USDJPYX Trading Predictions
1 Day Prediction
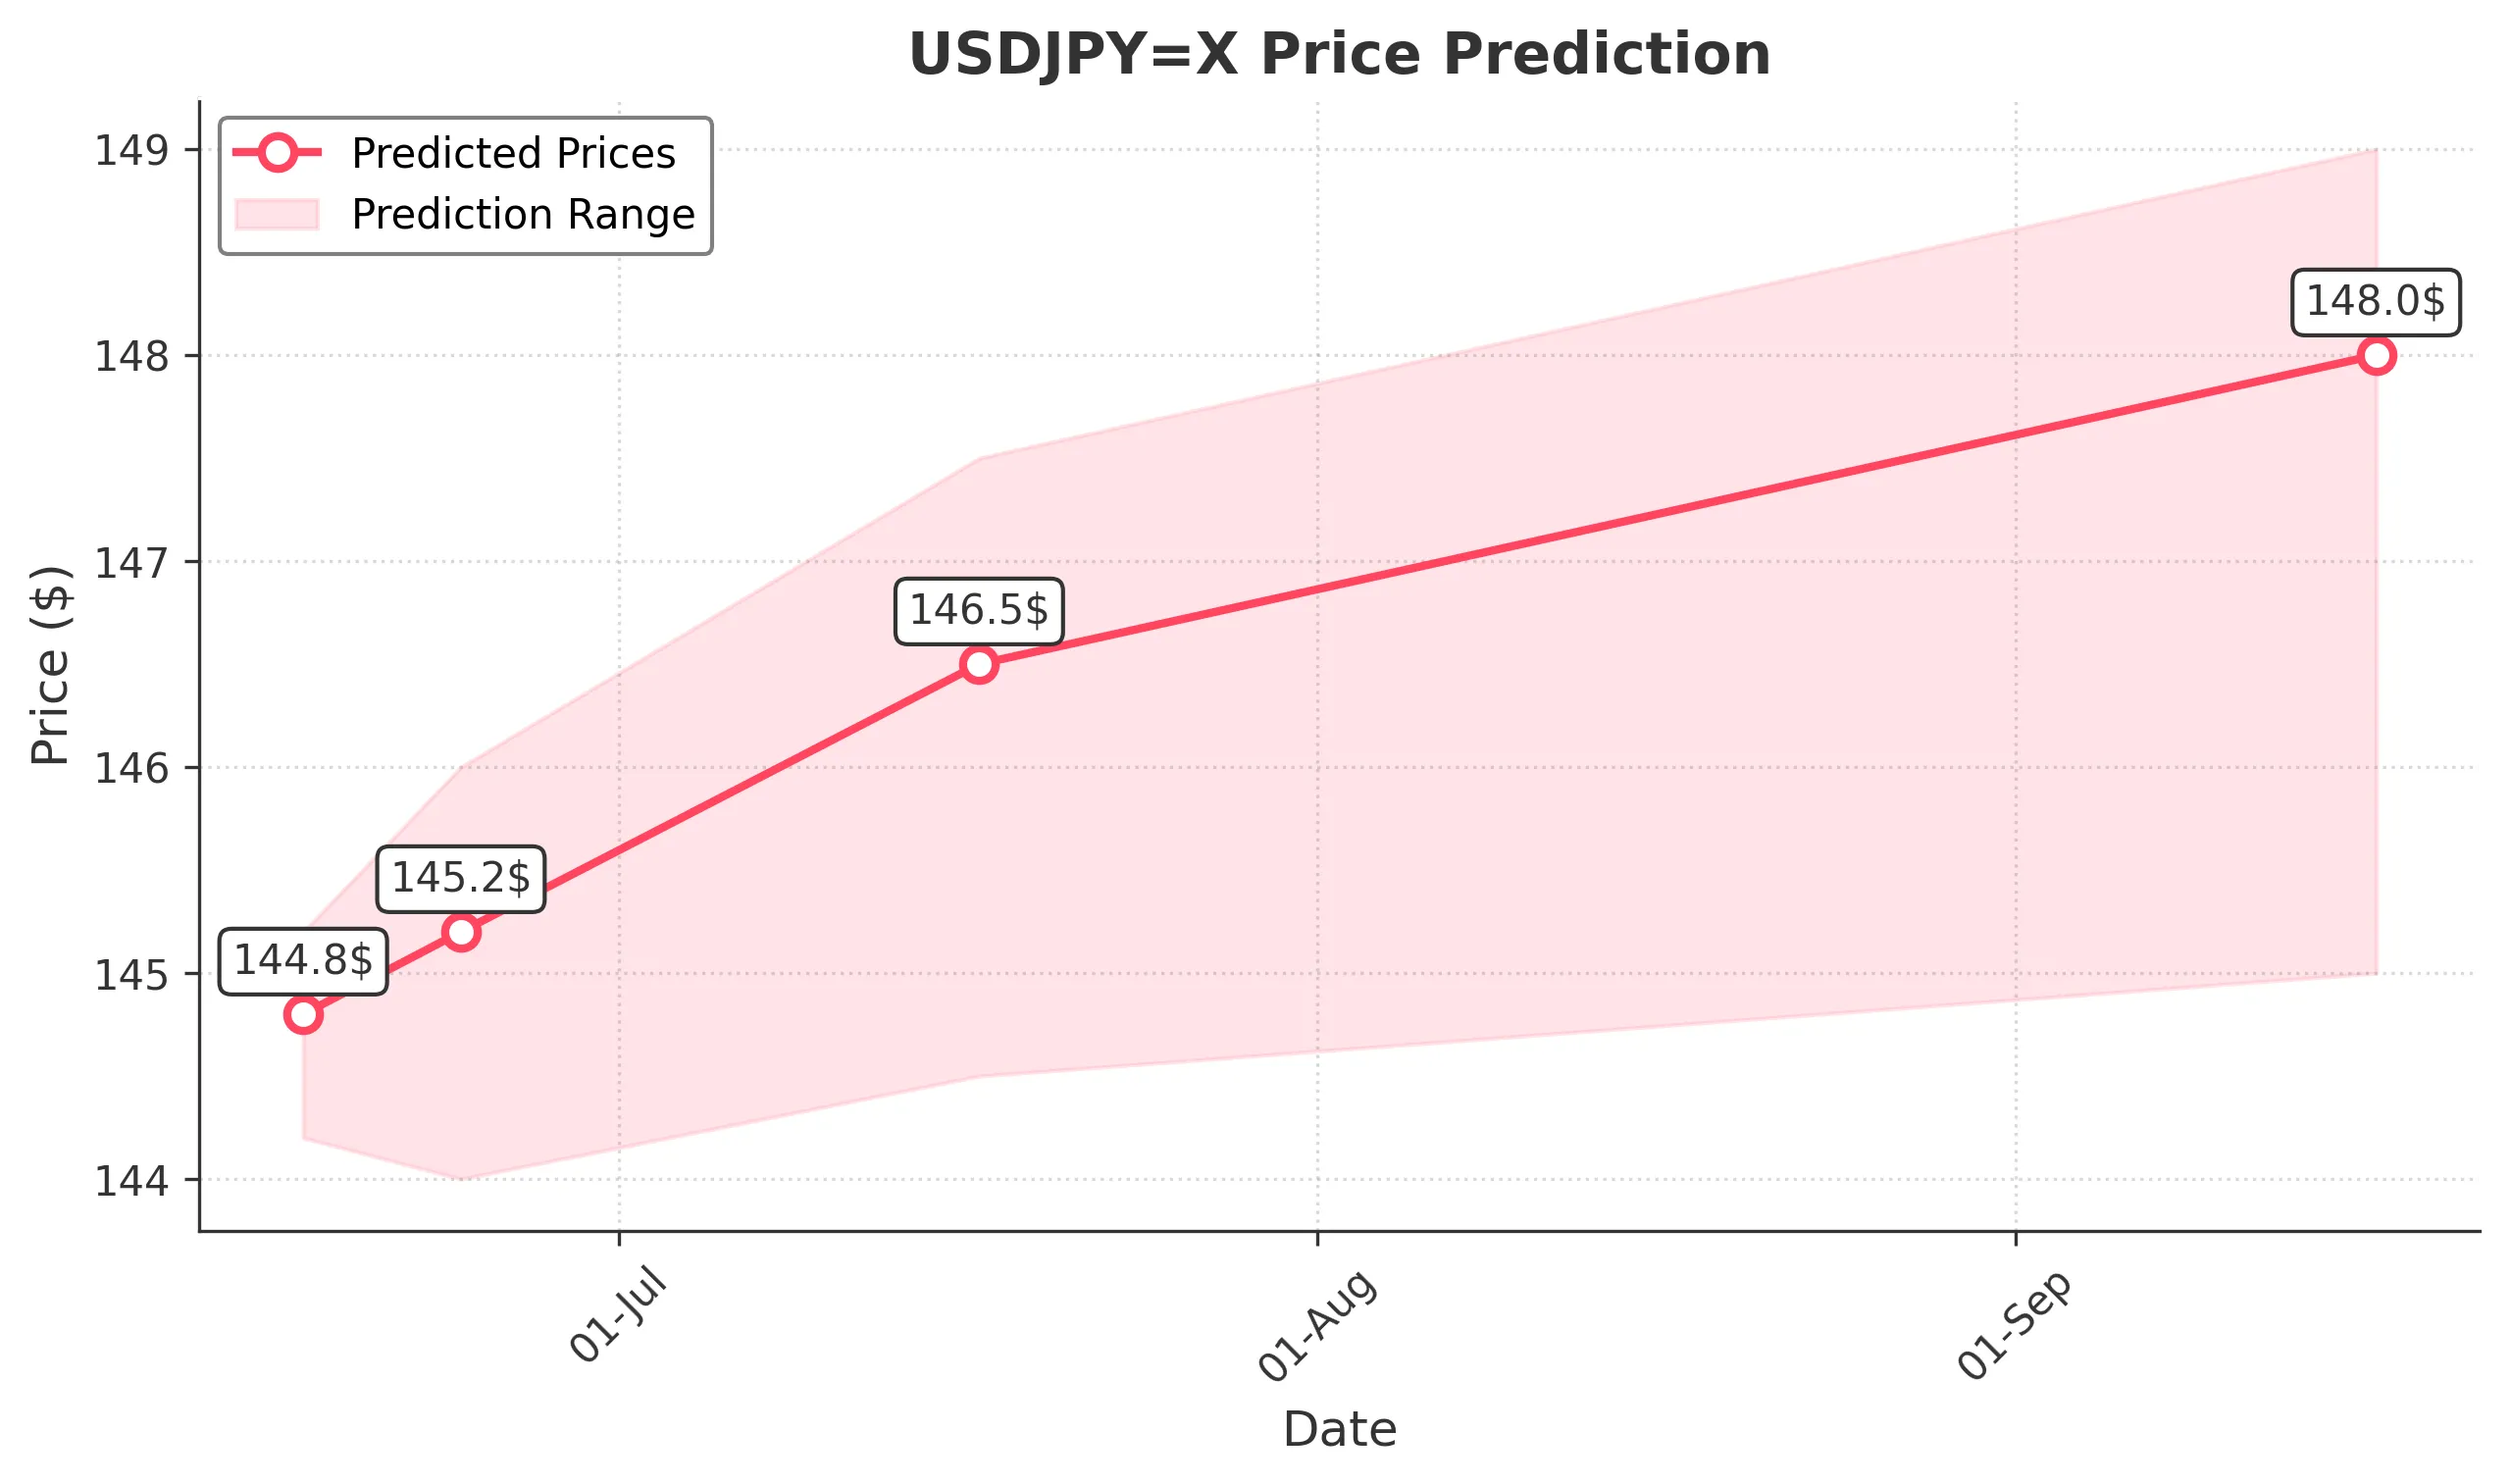
Target: June 17, 2025$144.8
$144.6
$145.2
$144.2
Description
The recent bullish momentum suggests a slight upward movement. The RSI is neutral, indicating no overbought conditions. A Doji pattern indicates indecision, but the overall trend remains bullish. Expect minor fluctuations.
Analysis
The past 3 months show a bearish trend with significant support around 143. The MACD indicates a potential bullish crossover, while the Bollinger Bands suggest a squeeze, indicating possible volatility. Volume has been low, indicating lack of strong conviction.
Confidence Level
Potential Risks
Market volatility and external economic news could impact this prediction.
1 Week Prediction
Target: June 24, 2025$145.2
$144.8
$146
$144
Description
A continuation of the current trend is expected, with potential resistance at 146. The MACD shows bullish momentum, while the RSI is approaching overbought territory. Watch for any reversal signals.
Analysis
The stock has shown a recovery from recent lows, with key resistance at 146. The moving averages are converging, indicating a potential breakout. However, the overall sentiment remains cautious due to macroeconomic uncertainties.
Confidence Level
Potential Risks
Potential for reversal if economic data releases are unfavorable.
1 Month Prediction
Target: July 17, 2025$146.5
$145.2
$147.5
$144.5
Description
Expect a gradual increase as bullish sentiment builds. The Fibonacci retracement levels suggest 146.50 as a target. However, watch for any bearish divergence in the RSI.
Analysis
The stock has been in a sideways trend with a slight bullish bias. Key support at 144. The ATR indicates low volatility, but any significant news could disrupt this trend. The market sentiment is mixed, reflecting uncertainty.
Confidence Level
Potential Risks
Economic indicators and geopolitical events could lead to unexpected volatility.
3 Months Prediction
Target: September 17, 2025$148
$146.5
$149
$145
Description
Long-term outlook suggests a bullish trend as economic recovery continues. The MACD indicates sustained upward momentum, but watch for potential resistance at 149.
Analysis
The overall trend has been bearish, but recent price action shows signs of recovery. Key resistance levels are at 149, while support remains at 145. The market is sensitive to economic data, which could influence future price movements.
Confidence Level
Potential Risks
Long-term predictions are subject to macroeconomic shifts and market sentiment changes.