USDJPYX Trading Predictions
1 Day Prediction
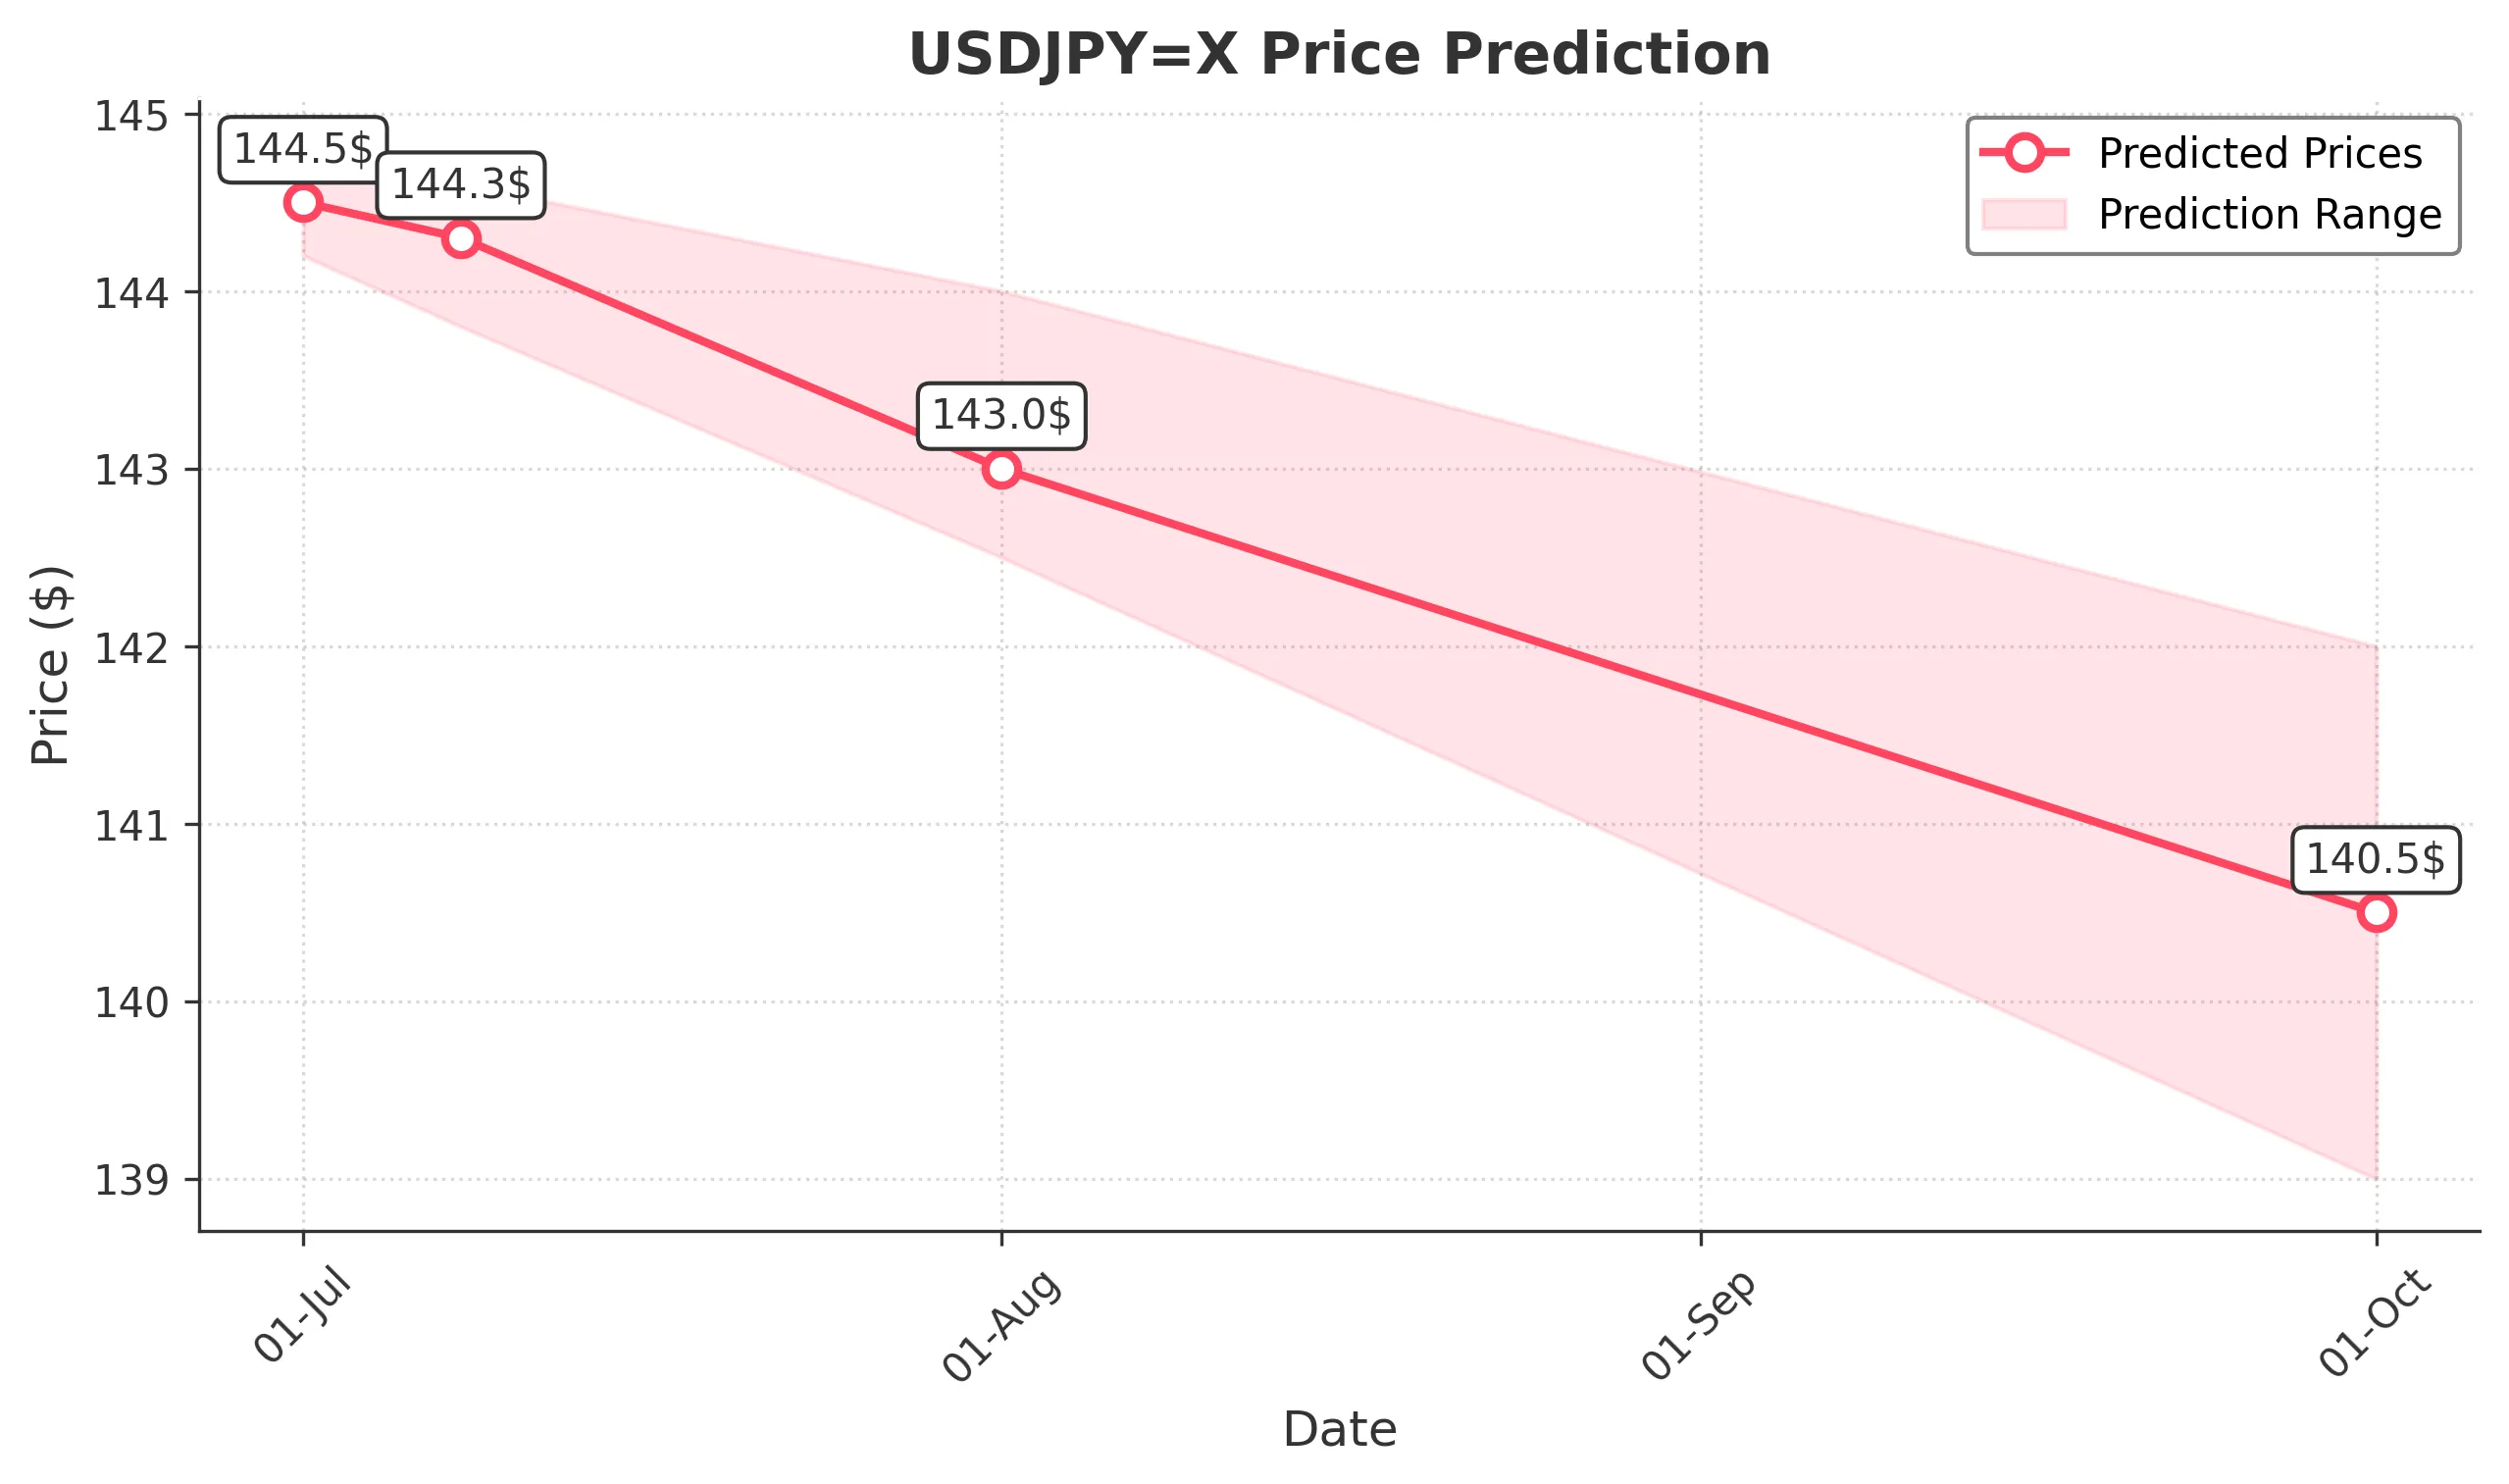
Target: July 1, 2025$144.5
$144.6
$144.8
$144.2
Description
The market shows signs of consolidation around the 144.50 level, with recent candlestick patterns indicating indecision. RSI is neutral, and MACD is flat, suggesting a potential for a slight pullback. Volume remains low, indicating lack of strong conviction.
Analysis
Over the past 3 months, USDJPY has shown a bearish trend with significant support at 144.00. Technical indicators like the RSI are neutral, while MACD shows a potential bearish crossover. Volume has been low, indicating weak buying interest.
Confidence Level
Potential Risks
Low volume could lead to unexpected volatility. A break below 144.20 may signal further declines.
1 Week Prediction
Target: July 8, 2025$144.3
$144.5
$144.6
$143.8
Description
The bearish trend may continue as the price approaches key support at 144.00. Recent candlestick patterns suggest potential selling pressure. The MACD indicates a bearish momentum, while the RSI is nearing oversold territory.
Analysis
The stock has been in a bearish phase, with resistance at 145.00 and support at 144.00. The ATR indicates low volatility, but any significant news could trigger sharp movements. Volume patterns suggest a lack of strong buying interest.
Confidence Level
Potential Risks
Market sentiment could shift with upcoming economic data releases, which may impact volatility.
1 Month Prediction
Target: August 1, 2025$143
$144.2
$144
$142.5
Description
A continuation of the bearish trend is expected as the price approaches the 143.00 level. The RSI indicates oversold conditions, but the MACD remains bearish. A break below 143.00 could lead to further declines.
Analysis
The overall trend has been bearish, with significant resistance at 145.00. The stock has shown weak buying interest, and the volume has been low. Key support at 143.00 is critical; a break could lead to further declines.
Confidence Level
Potential Risks
Potential for a reversal exists if bullish economic data is released, which could change market sentiment.
3 Months Prediction
Target: October 1, 2025$140.5
$143
$142
$139
Description
The bearish trend is likely to persist, with potential for the price to test lower support levels around 140.00. The MACD indicates continued bearish momentum, while the RSI may remain in oversold territory.
Analysis
The stock has been in a bearish trend, with key support at 140.00. Technical indicators suggest continued weakness, but any positive economic news could shift sentiment. Volume patterns indicate a lack of strong buying interest.
Confidence Level
Potential Risks
Unforeseen macroeconomic events or changes in market sentiment could lead to volatility and impact the prediction.