USDJPYX Trading Predictions
1 Day Prediction
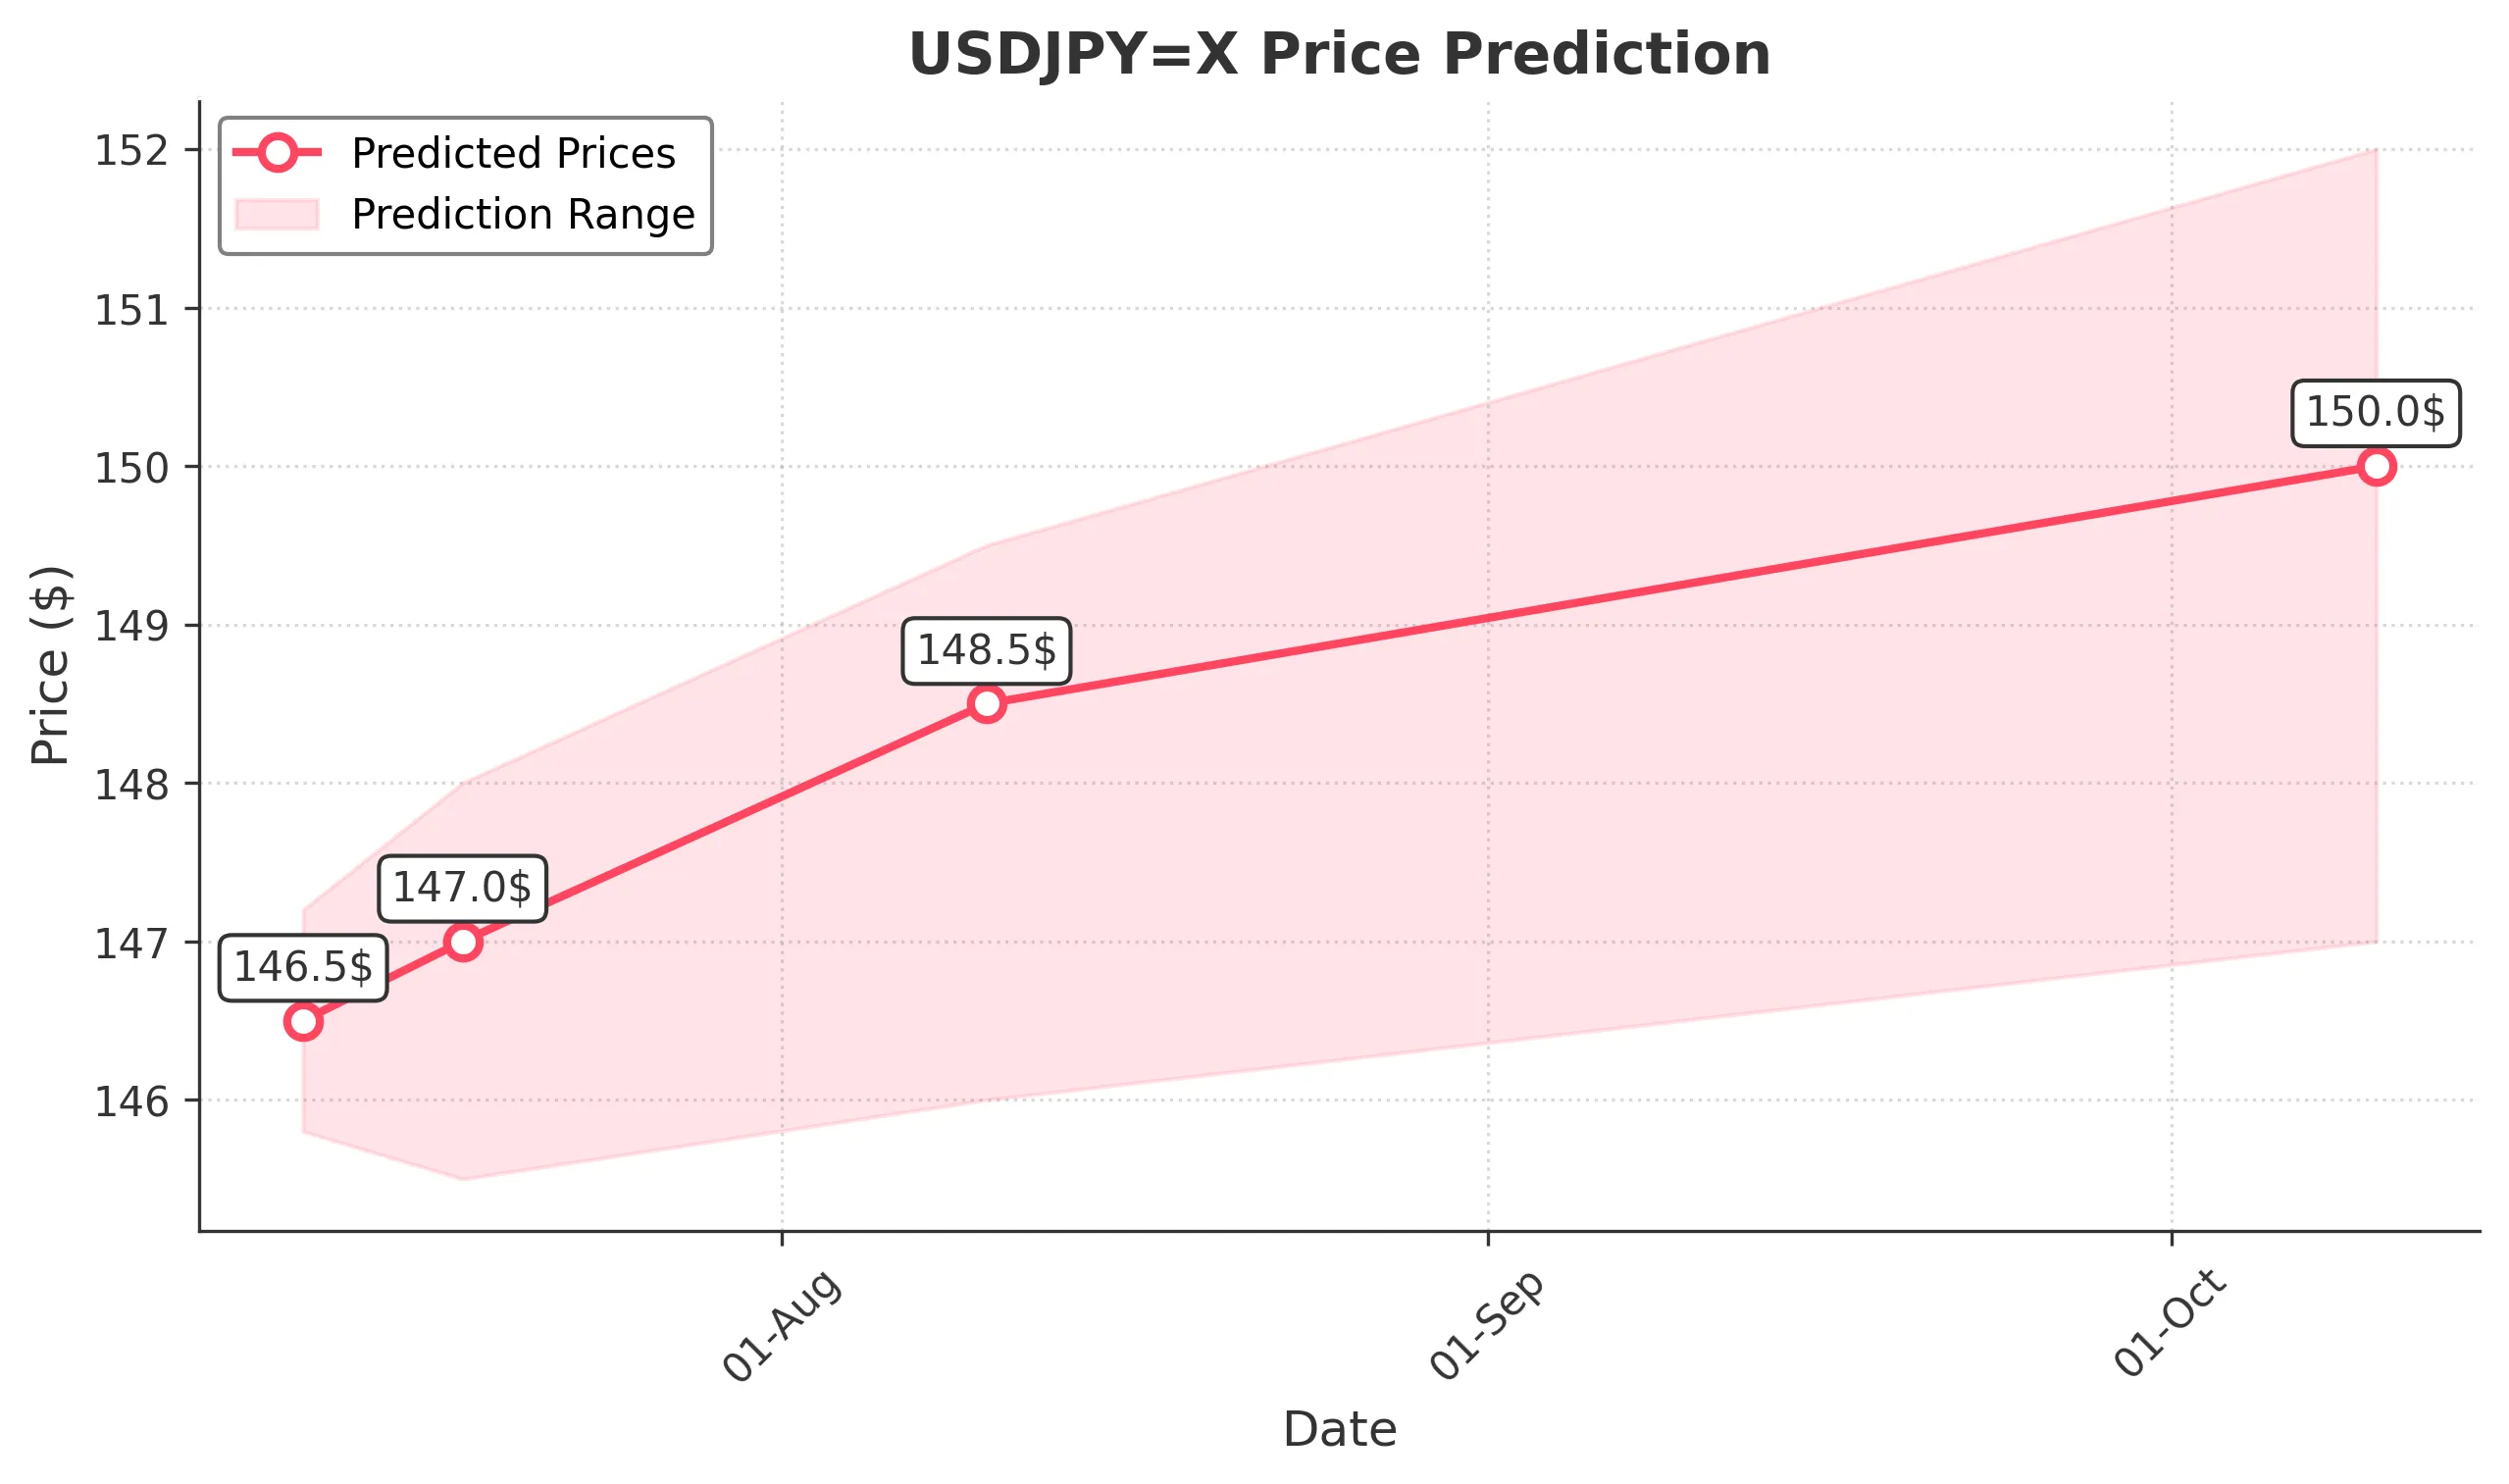
Target: July 11, 2025$146.5
$146.3
$147.2
$145.8
Description
The recent bullish momentum, indicated by the upward trend in the last few days and a potential breakout above resistance levels, suggests a close around 146.500. RSI is neutral, and MACD shows a bullish crossover.
Analysis
The stock has shown a bullish trend over the past three months, with significant support at 144.00 and resistance around 147.00. The MACD is bullish, and the RSI is stable, indicating potential upward movement.
Confidence Level
Potential Risks
Market volatility and external economic news could impact this prediction.
1 Week Prediction
Target: July 18, 2025$147
$146.8
$148
$145.5
Description
With the current bullish trend and potential for further gains, a close of 147.000 is expected. The Bollinger Bands suggest upward pressure, while the MACD remains positive.
Analysis
The stock has been trending upward, with key support at 144.00 and resistance at 148.00. The volume has been stable, and the ATR indicates moderate volatility, suggesting a cautious bullish outlook.
Confidence Level
Potential Risks
Possible market corrections or geopolitical events could lead to unexpected price movements.
1 Month Prediction
Target: August 10, 2025$148.5
$147.8
$149.5
$146
Description
The bullish trend is expected to continue, with a close around 148.500. Fibonacci retracement levels support this upward movement, and the MACD remains bullish.
Analysis
The stock has shown a strong upward trend, with significant resistance at 149.00. The RSI is approaching overbought territory, indicating potential for a pullback. Volume patterns suggest healthy buying interest.
Confidence Level
Potential Risks
Economic data releases and central bank decisions could introduce volatility.
3 Months Prediction
Target: October 10, 2025$150
$149
$152
$147
Description
Long-term bullish sentiment suggests a close of 150.000, supported by strong economic indicators and technical patterns. However, potential resistance at 152.00 may limit gains.
Analysis
The stock has been on a bullish trajectory, with key support at 145.00 and resistance at 152.00. The MACD is bullish, but the RSI indicates potential overbought conditions, suggesting caution for long-term investors.
Confidence Level
Potential Risks
Long-term predictions are subject to macroeconomic changes and market sentiment shifts.