USDJPYX Trading Predictions
1 Day Prediction
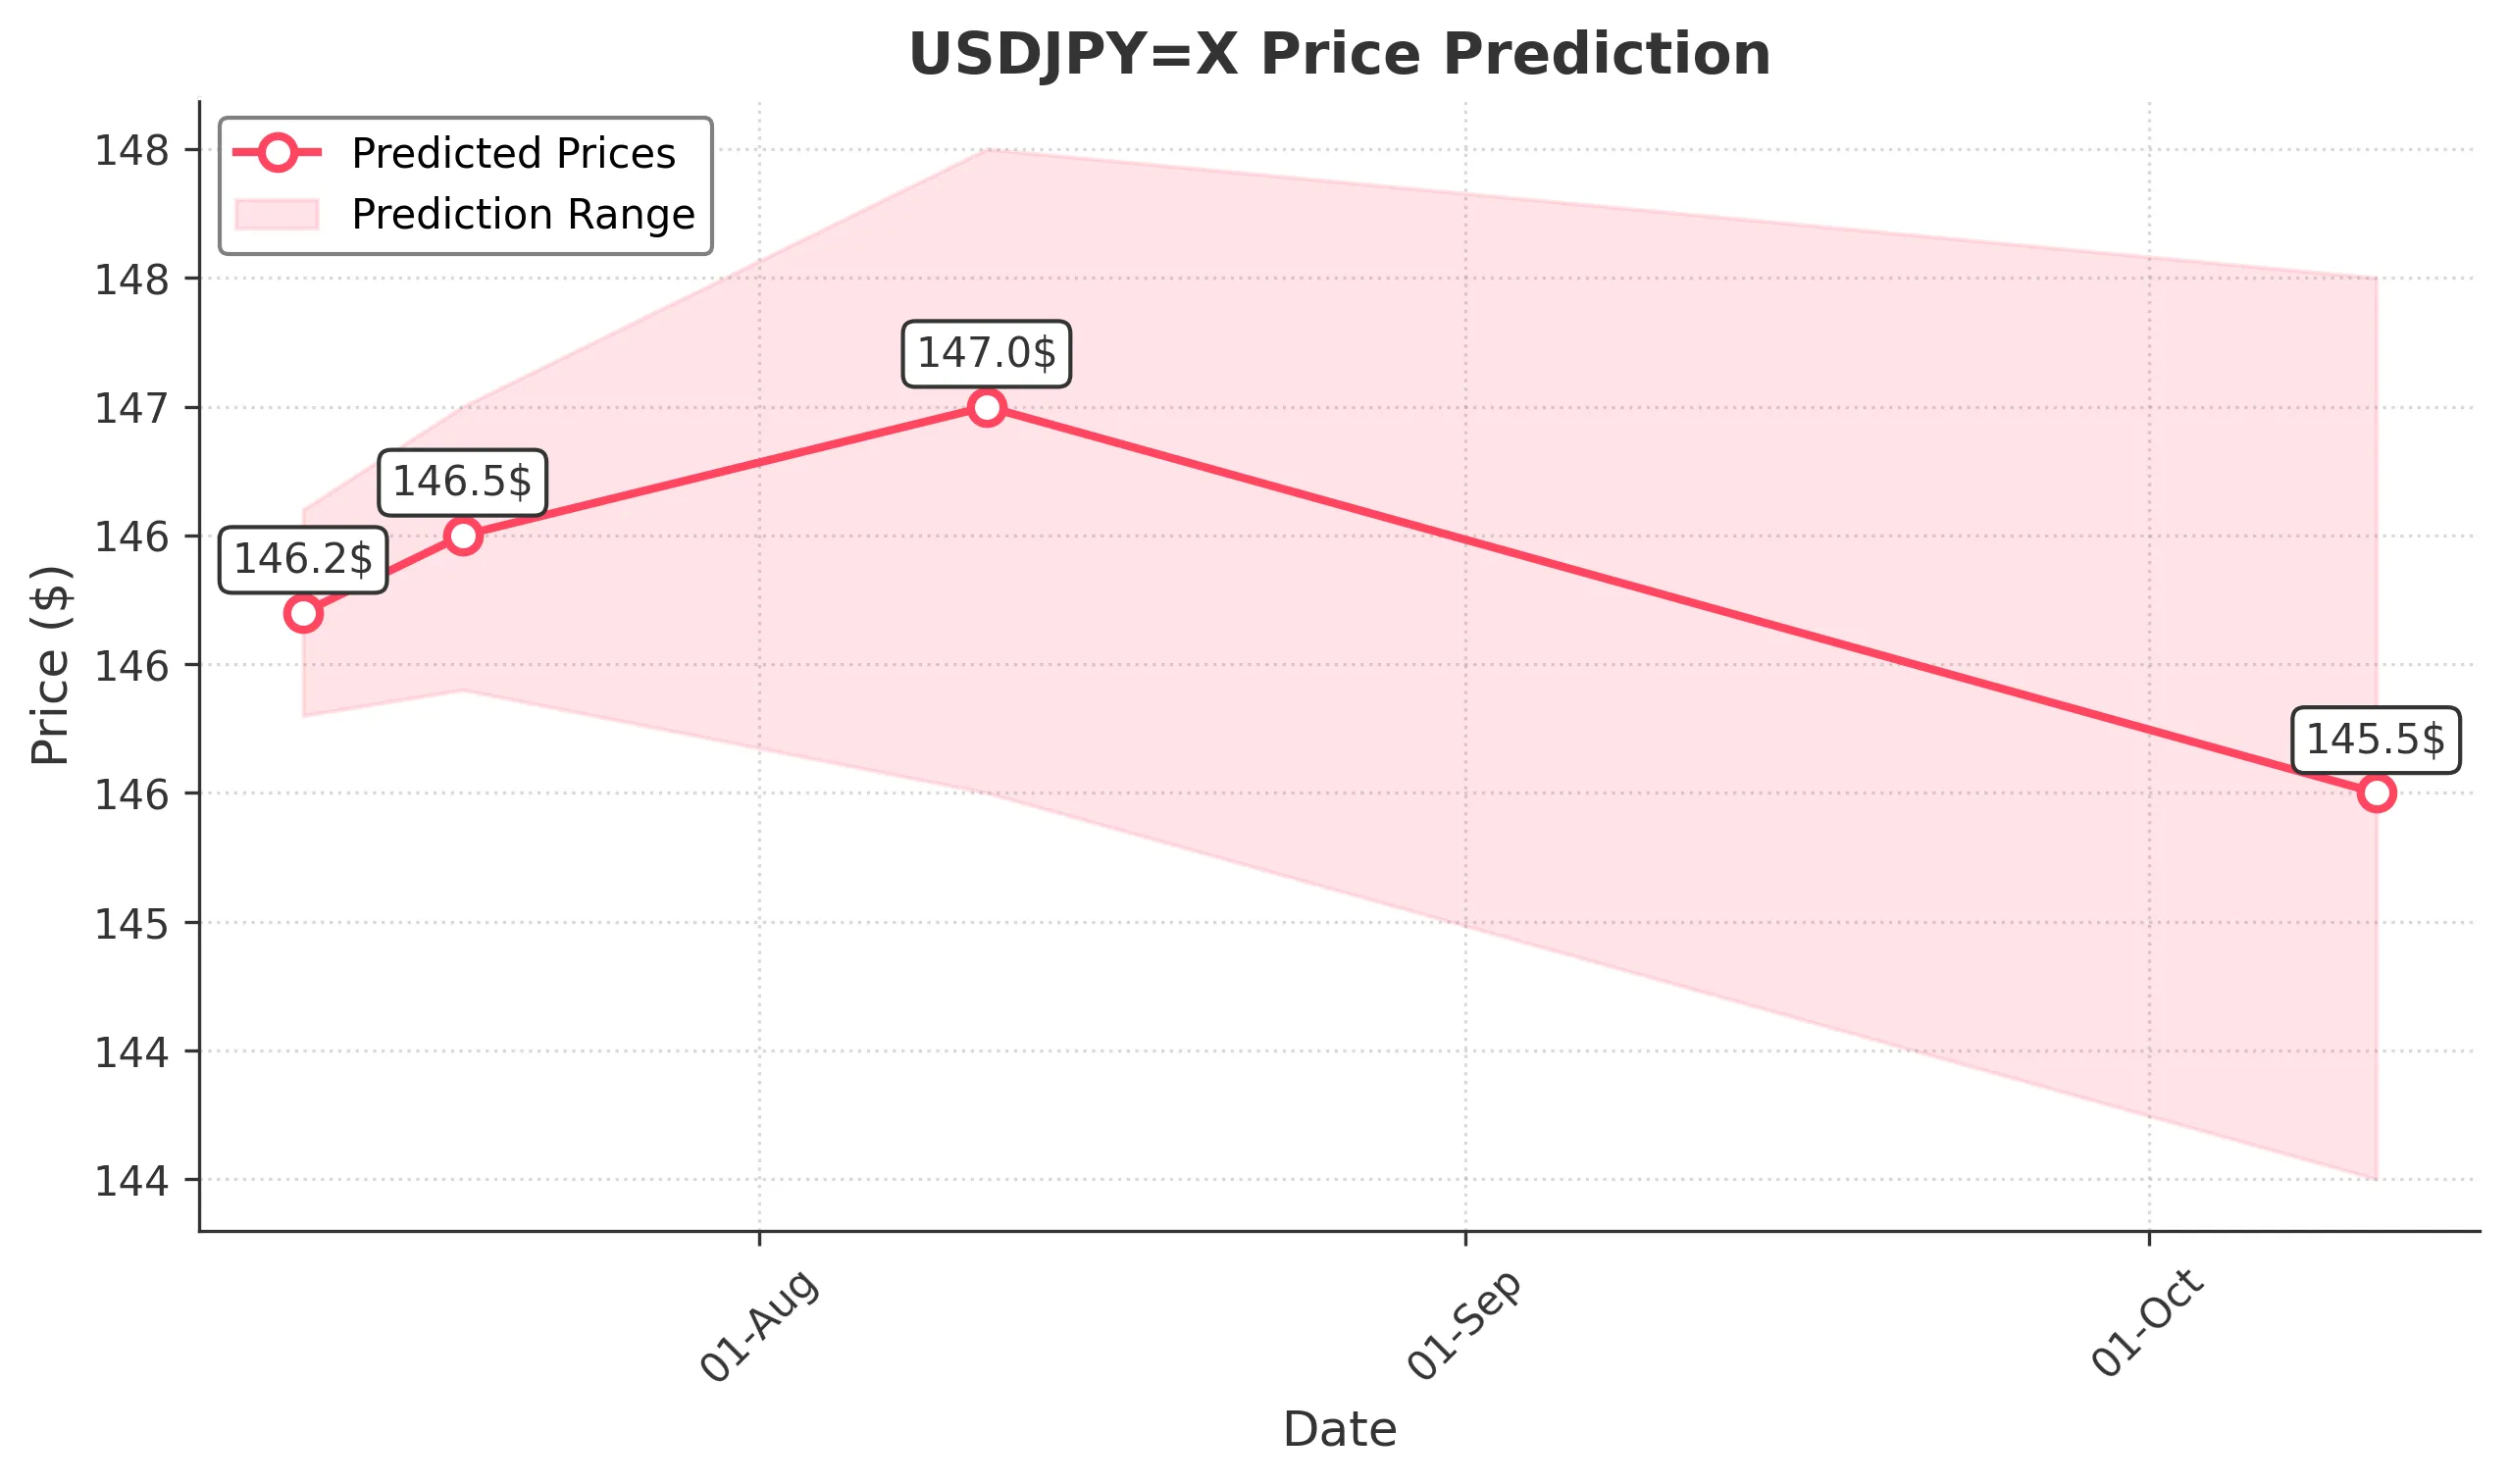
Target: July 12, 2025$146.2
$146.15
$146.6
$145.8
Description
The recent bullish trend, supported by a strong MACD crossover and RSI indicating upward momentum, suggests a close around 146.200. However, potential resistance at 146.600 may limit gains.
Analysis
The past 3 months show a bullish trend with significant support at 144.00 and resistance around 147.00. The MACD is bullish, and RSI is nearing overbought levels, indicating potential pullbacks.
Confidence Level
Potential Risks
Market volatility and external economic news could impact the prediction.
1 Week Prediction
Target: July 19, 2025$146.5
$146.2
$147
$145.9
Description
Continued bullish momentum is expected, with the price likely to test resistance at 147.00. The RSI remains strong, but caution is advised as it approaches overbought territory.
Analysis
The stock has shown consistent upward movement, with key support at 144.00. The MACD remains positive, and volume has been stable, indicating healthy buying interest.
Confidence Level
Potential Risks
Any geopolitical events or economic data releases could lead to unexpected volatility.
1 Month Prediction
Target: August 11, 2025$147
$146.5
$148
$145.5
Description
A bullish outlook persists, with the price expected to reach 147.000 as it tests upper resistance levels. However, the RSI indicates potential overbought conditions, suggesting a possible correction.
Analysis
The stock has been in a bullish phase, with strong support at 144.00. The MACD is bullish, but the RSI is approaching overbought levels, indicating a potential pullback.
Confidence Level
Potential Risks
Market corrections or profit-taking could lead to a decline, especially if economic indicators disappoint.
3 Months Prediction
Target: October 11, 2025$145.5
$146
$147.5
$144
Description
Expect a potential pullback to around 145.500 as the market may correct after reaching recent highs. The RSI suggests overbought conditions, and profit-taking could occur.
Analysis
The stock has shown a strong bullish trend, but with increasing volatility and potential resistance at 147.00. The MACD is still positive, but the RSI indicates a need for caution.
Confidence Level
Potential Risks
Unforeseen economic events or shifts in market sentiment could lead to significant price changes.