USDJPYX Trading Predictions
1 Day Prediction
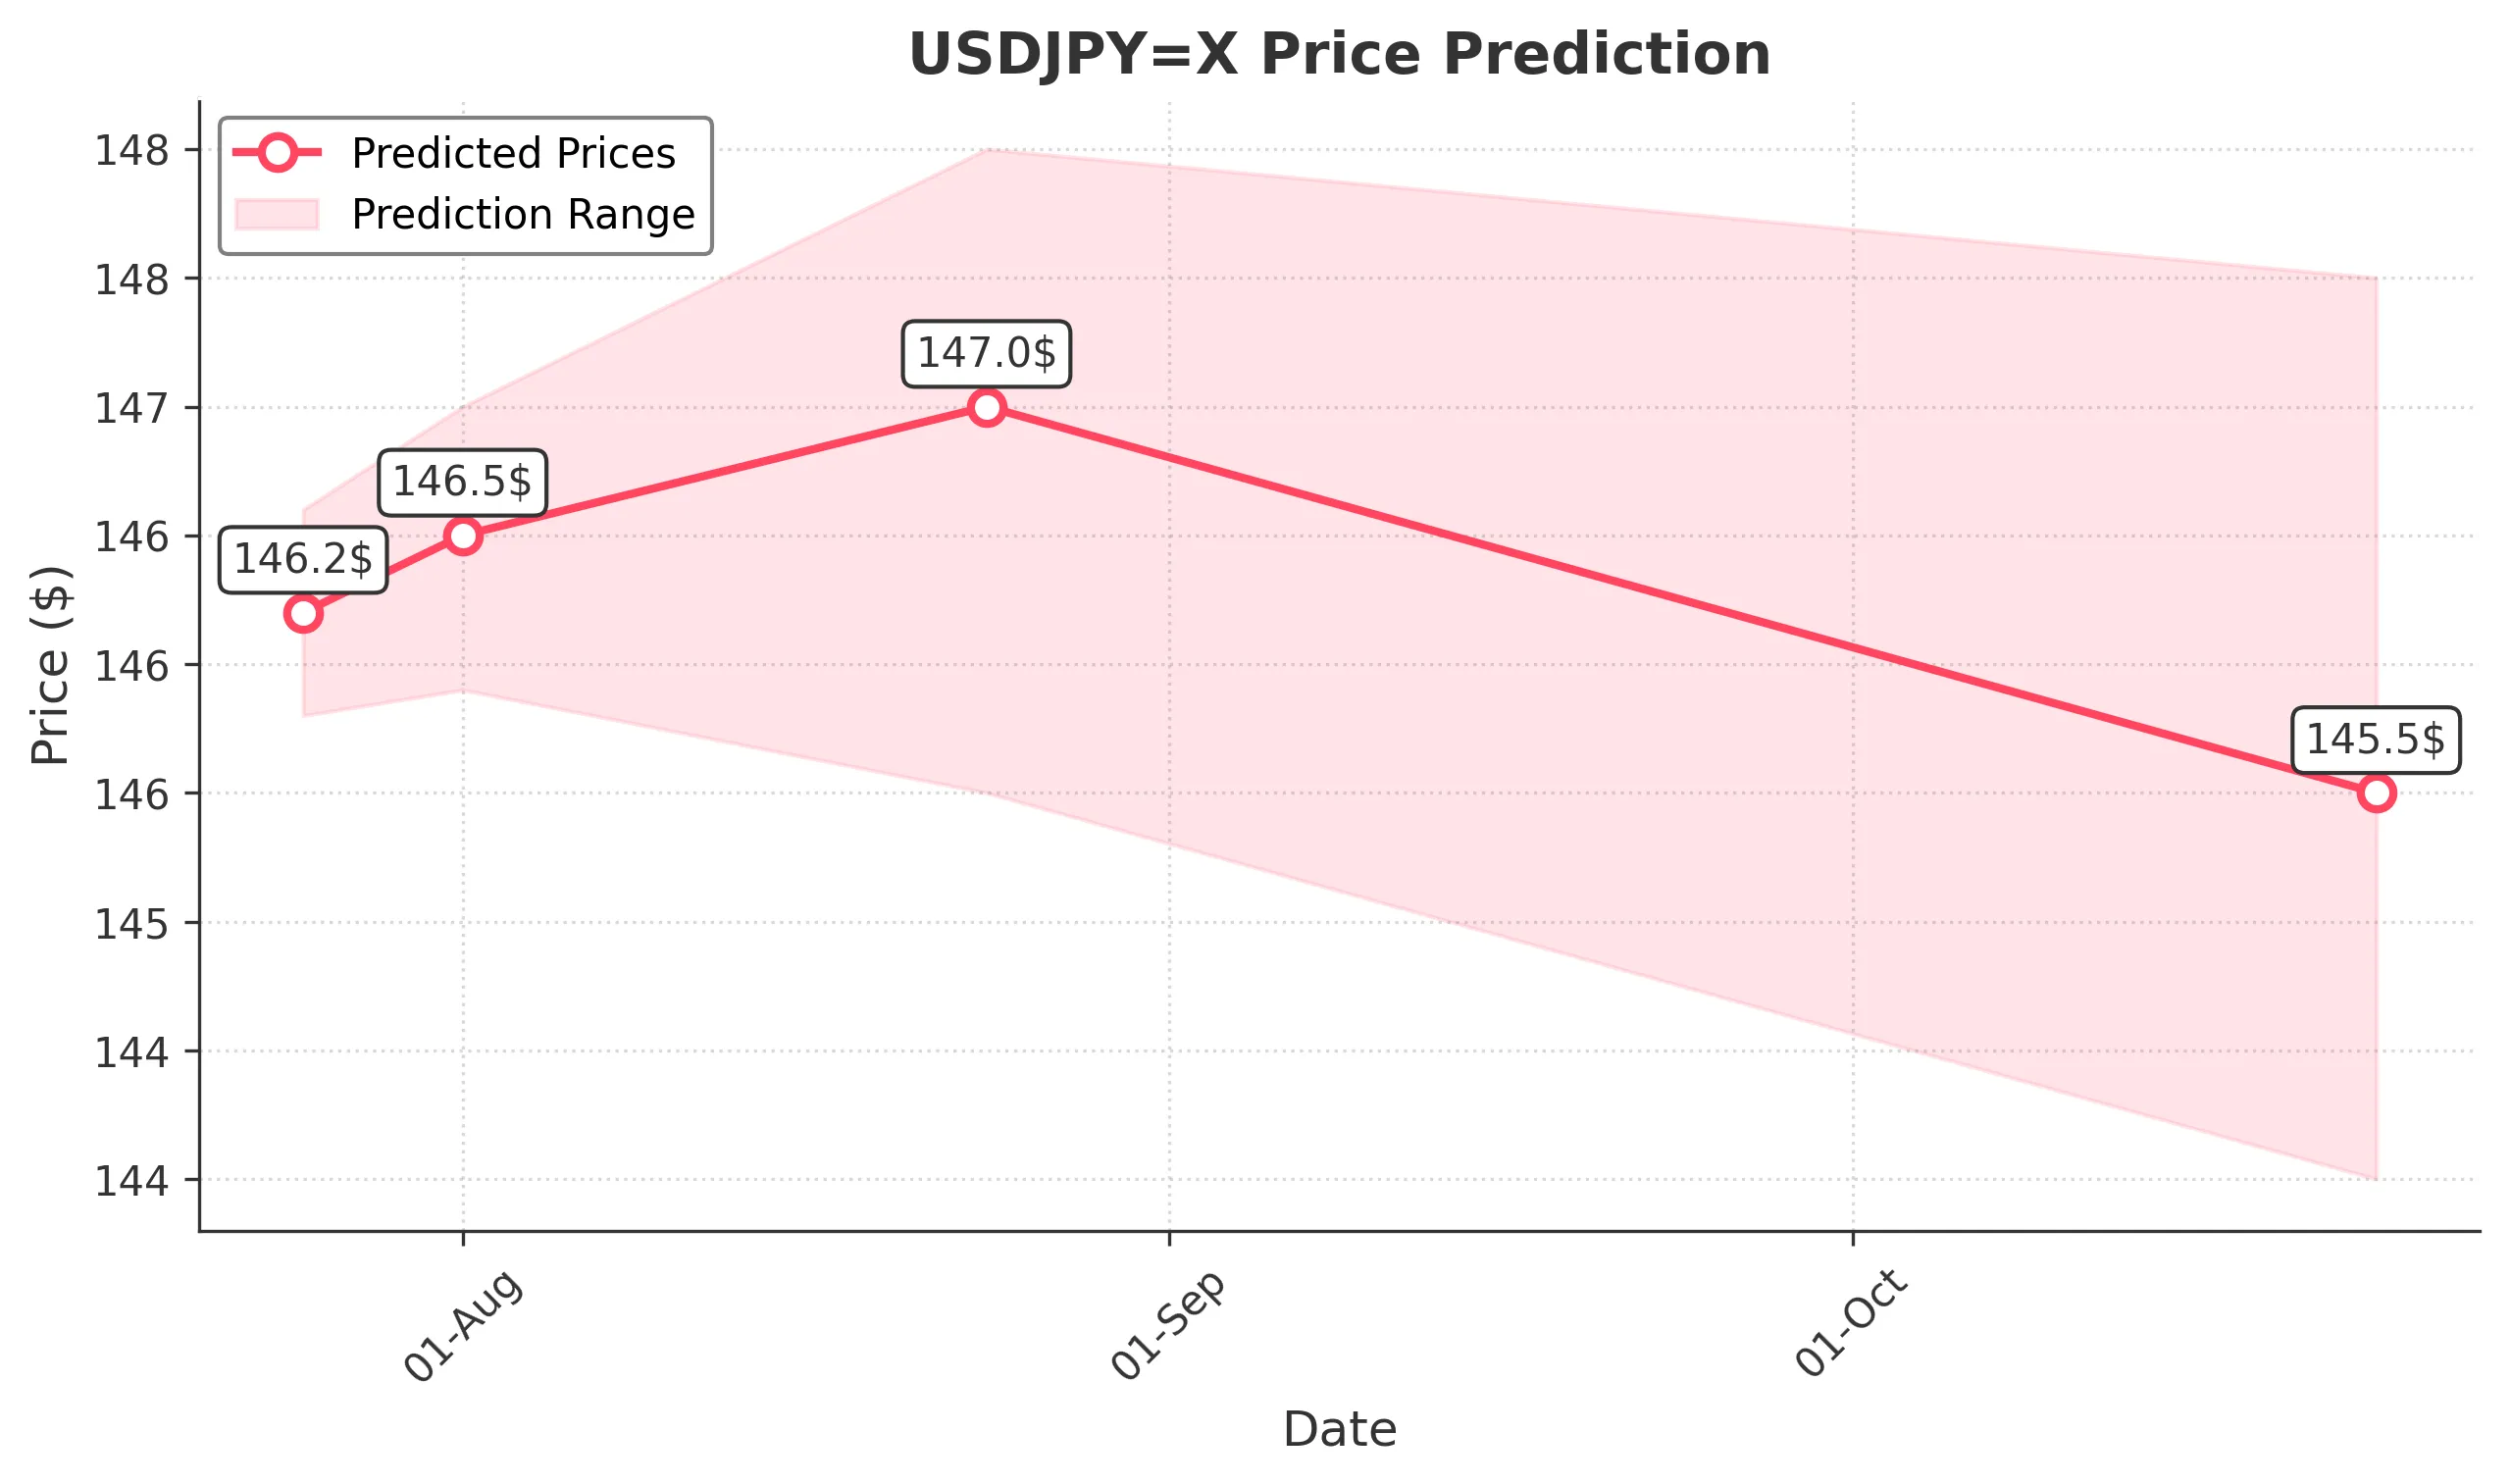
Target: July 25, 2025$146.2
$146.1
$146.6
$145.8
Description
The recent bullish trend indicates a potential continuation, supported by a recent Doji pattern suggesting indecision. The RSI is near 60, indicating strength, while MACD shows a bullish crossover. However, volatility remains a concern.
Analysis
Over the past 3 months, USDJPY has shown a bullish trend with significant resistance around 148. The MACD indicates upward momentum, while the RSI suggests the market is not overbought. Volume has been stable, but spikes were noted during key price movements.
Confidence Level
Potential Risks
Market sentiment could shift due to external economic news or geopolitical events, which may impact the prediction.
1 Week Prediction
Target: August 1, 2025$146.5
$146.2
$147
$145.9
Description
The bullish momentum is expected to continue into next week, supported by a recent upward trend and positive market sentiment. The Bollinger Bands are widening, indicating potential volatility. However, resistance at 147 may limit gains.
Analysis
The stock has been in a bullish phase, with key support at 145. The MACD remains positive, and the RSI is approaching overbought territory. Volume patterns suggest healthy trading activity, but caution is advised as the market approaches resistance levels.
Confidence Level
Potential Risks
Potential market corrections or external economic factors could lead to unexpected price movements.
1 Month Prediction
Target: August 24, 2025$147
$146.8
$148
$145.5
Description
Expect a gradual increase in price as the market stabilizes. The Fibonacci retracement levels suggest a target around 147. The RSI may indicate overbought conditions, which could lead to a pullback. Watch for volume spikes.
Analysis
The overall trend remains bullish, with significant support at 145. The MACD indicates continued upward momentum, while the RSI suggests caution as it approaches overbought levels. Volume has been consistent, but any spikes could indicate reversals.
Confidence Level
Potential Risks
Economic data releases and geopolitical tensions could create volatility, impacting the price direction.
3 Months Prediction
Target: October 24, 2025$145.5
$146
$147.5
$144
Description
A potential correction may occur as the market approaches resistance levels. The MACD may show signs of divergence, indicating weakening momentum. The RSI could drop below 50, suggesting bearish sentiment.
Analysis
The stock has shown a strong bullish trend, but signs of potential reversal are emerging. Key resistance at 148 may limit further gains. The MACD is approaching a bearish crossover, and the RSI indicates potential overbought conditions. Volume patterns suggest caution.
Confidence Level
Potential Risks
Unforeseen macroeconomic events or shifts in market sentiment could lead to significant price fluctuations.