USDJPYX Trading Predictions
1 Day Prediction
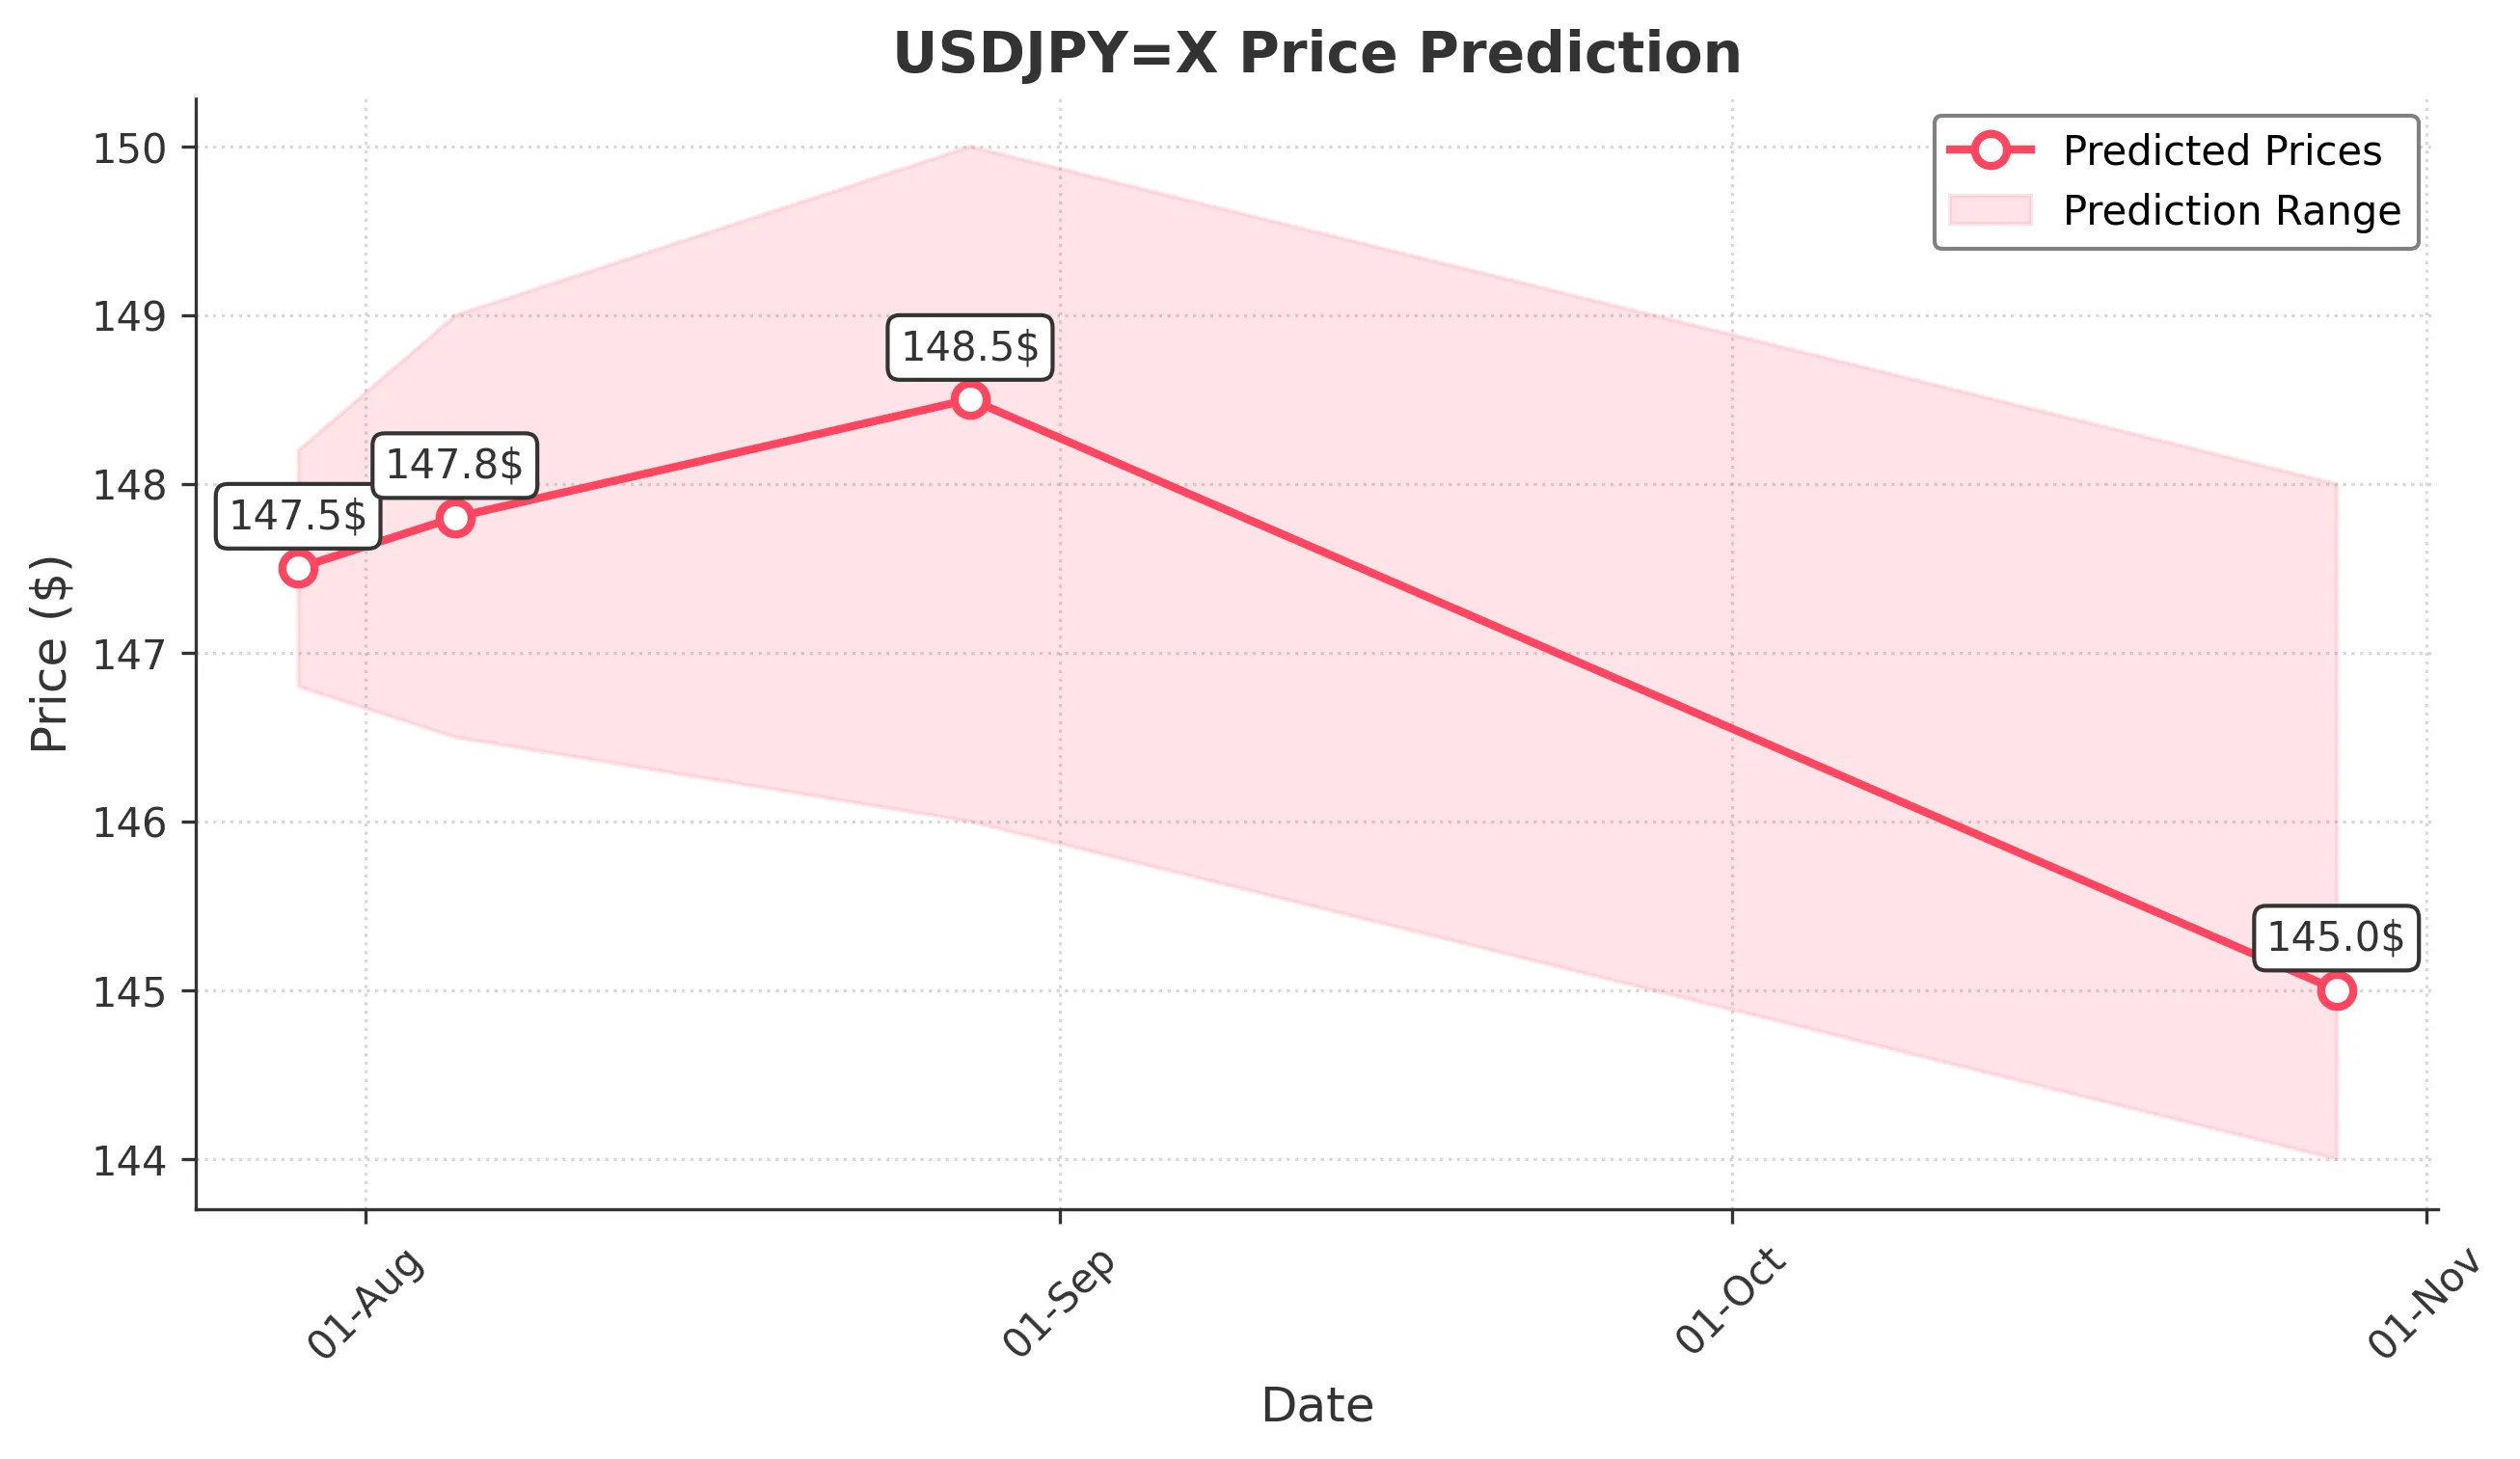
Target: July 29, 2025$147.5
$147.3
$148.2
$146.8
Description
The market shows a slight bullish trend with a recent Doji candlestick indicating indecision. The RSI is near 60, suggesting potential upward momentum. However, MACD is flattening, indicating possible resistance ahead.
Analysis
Over the past 3 months, USDJPY has shown a bullish trend with significant resistance around 148. The recent price action indicates consolidation, with support at 146. The RSI and MACD suggest upward momentum, but caution is warranted due to potential reversals.
Confidence Level
Potential Risks
Potential reversal signals and market volatility could impact the prediction.
1 Week Prediction
Target: August 5, 2025$147.8
$147.6
$149
$146.5
Description
The bullish trend is expected to continue, supported by a recent breakout above resistance levels. However, the Bollinger Bands indicate tightening, suggesting potential volatility. Watch for volume spikes for confirmation.
Analysis
The stock has been trending upward, with key support at 146. The MACD indicates bullish momentum, but the RSI nearing overbought levels raises concerns about sustainability. Volume patterns suggest cautious optimism.
Confidence Level
Potential Risks
Market sentiment and external economic factors could lead to unexpected price movements.
1 Month Prediction
Target: August 28, 2025$148.5
$147.8
$150
$146
Description
Expect continued bullish momentum as the price approaches Fibonacci retracement levels. However, the RSI indicates overbought conditions, which may lead to a pullback. Monitor for any bearish candlestick patterns.
Analysis
The past three months show a strong bullish trend, with resistance at 150. The MACD supports upward movement, but the RSI suggests caution. Volume has been stable, but any spikes could indicate reversals.
Confidence Level
Potential Risks
Economic data releases and geopolitical events could significantly impact market direction.
3 Months Prediction
Target: October 28, 2025$145
$146.5
$148
$144
Description
A potential bearish reversal is anticipated as the market approaches key resistance levels. The MACD may cross below the signal line, indicating weakening momentum. Watch for bearish candlestick patterns.
Analysis
The overall trend has been bullish, but signs of exhaustion are emerging. Key resistance at 150 may trigger profit-taking. The RSI is approaching overbought territory, and any negative news could lead to a sharp decline.
Confidence Level
Potential Risks
Unforeseen macroeconomic events could lead to significant volatility and impact the prediction.