USDJPYX Trading Predictions
1 Day Prediction
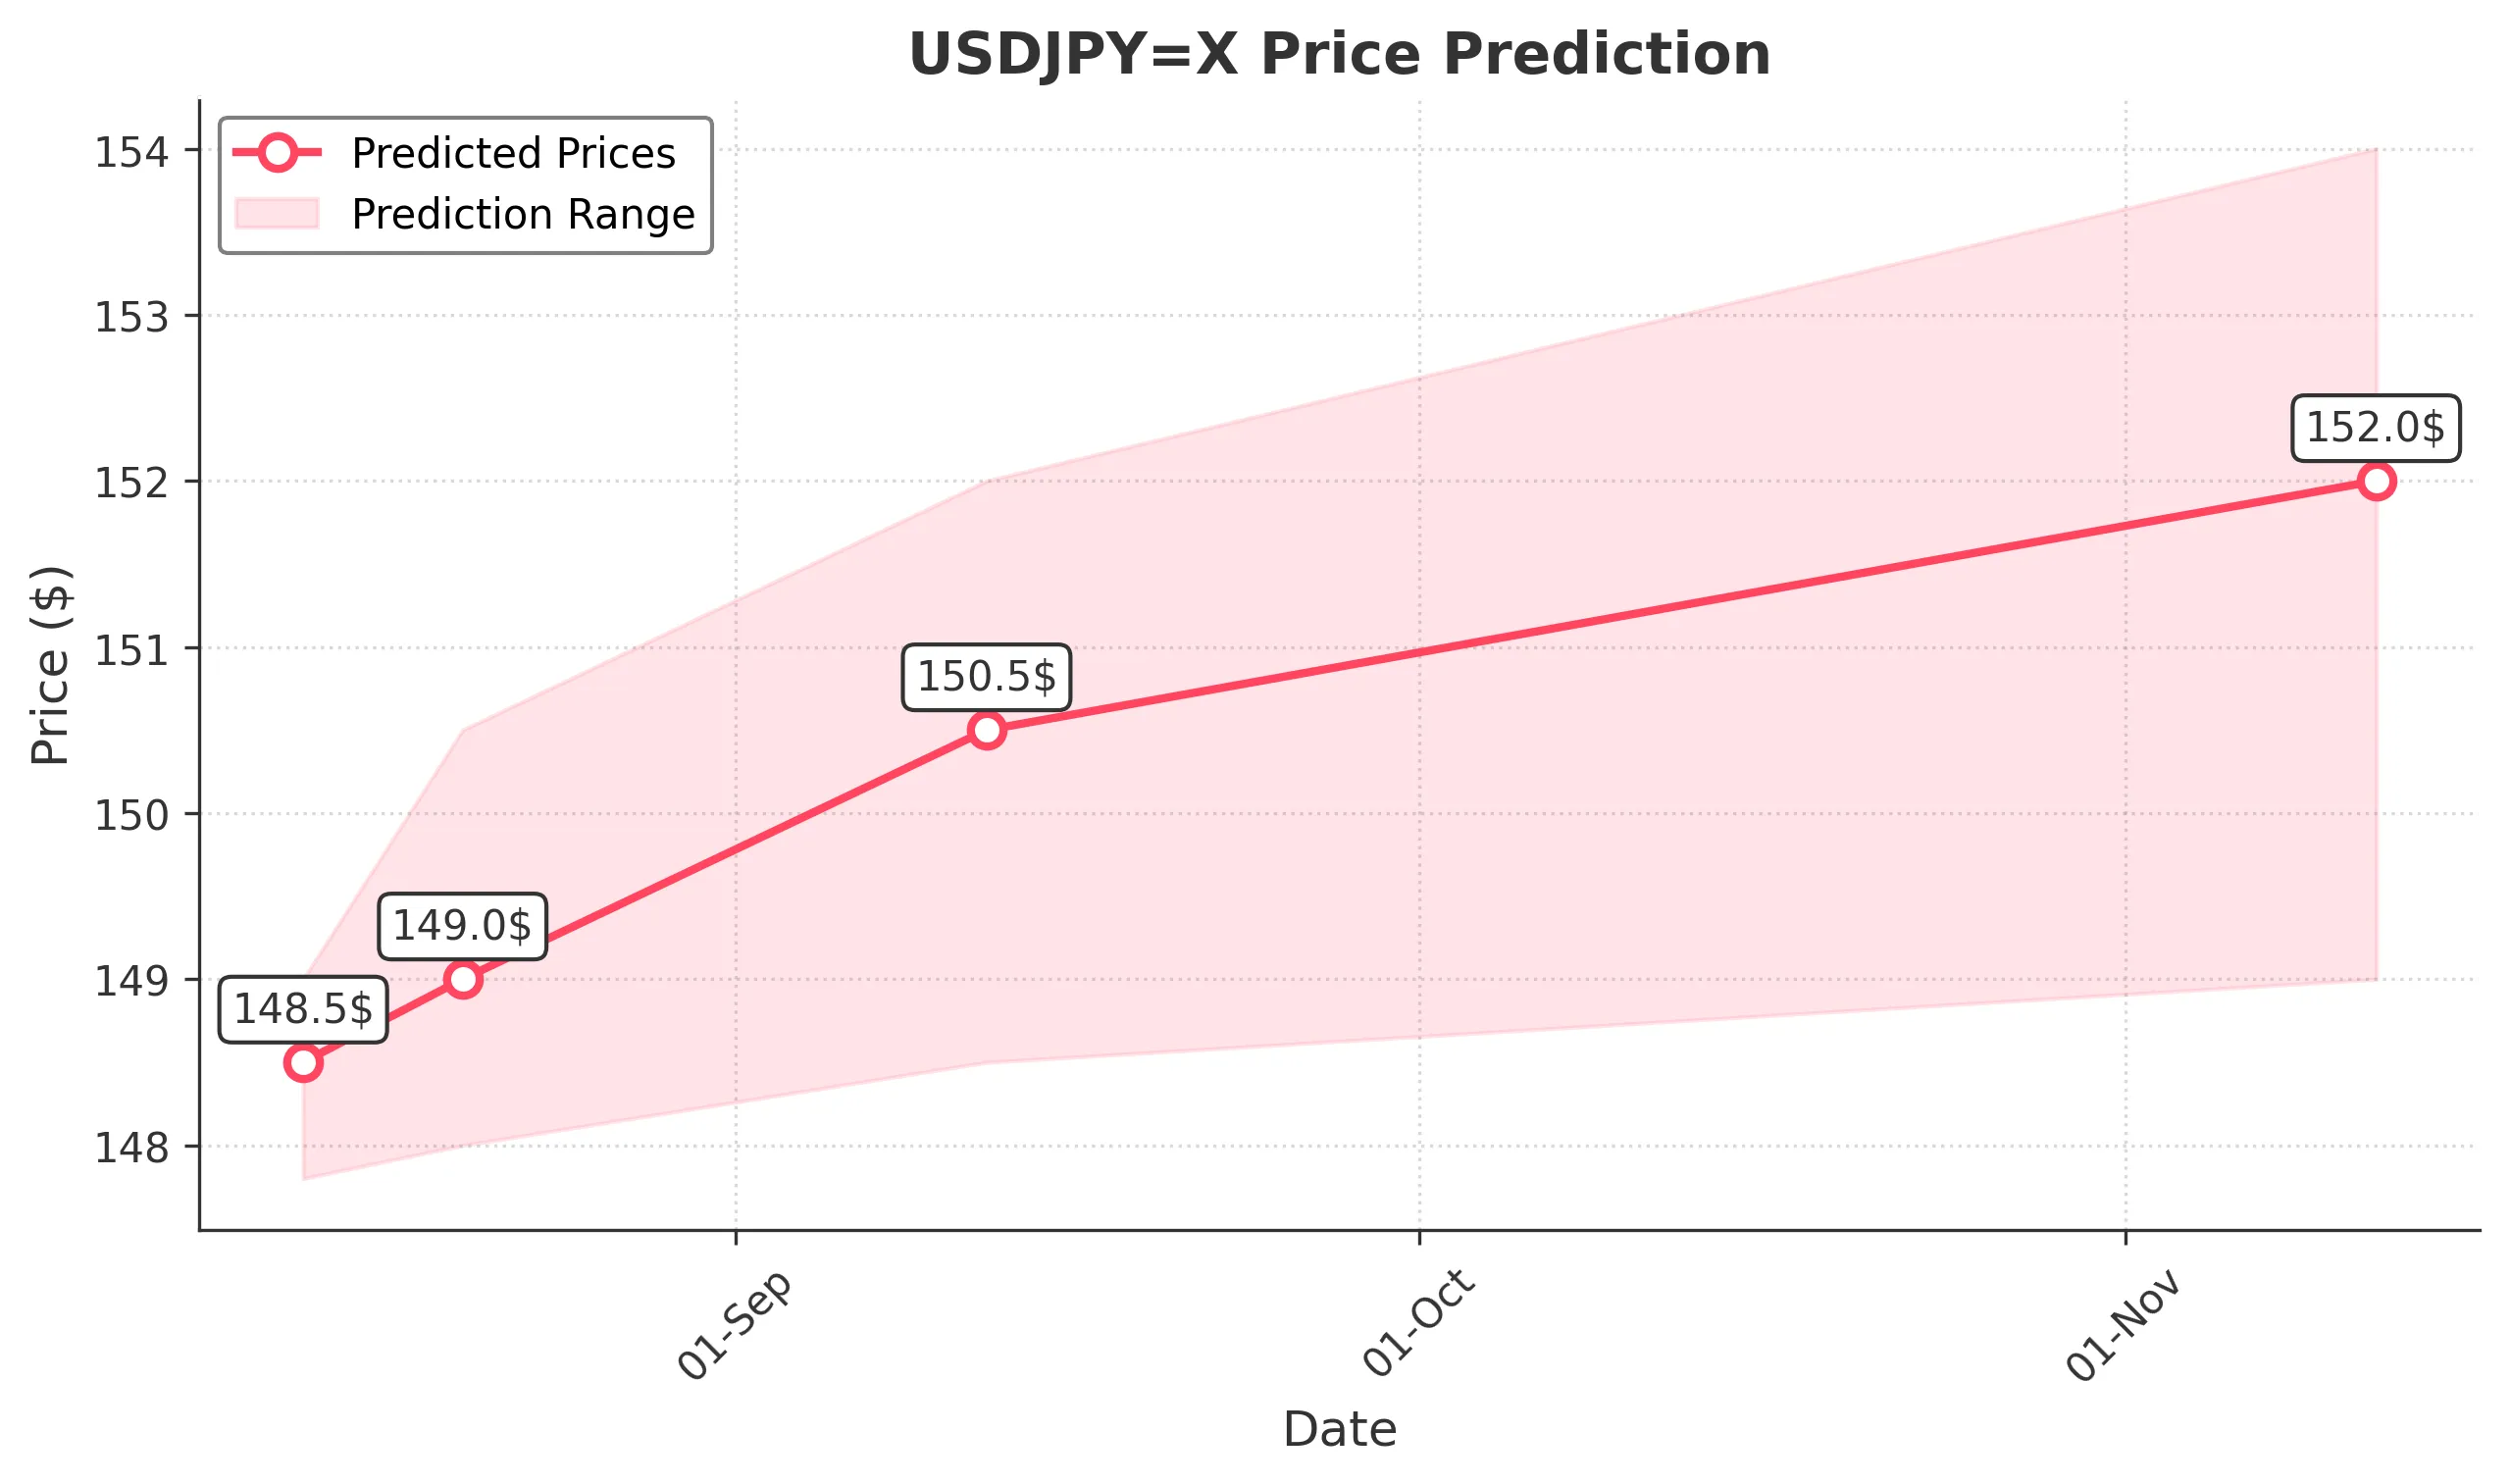
Target: August 13, 2025$148.5
$148.2
$149
$147.8
Description
The recent bullish momentum, indicated by the upward trend in the last few days and a potential breakout above resistance levels, suggests a close around 148.500. RSI is neutral, and MACD shows a bullish crossover.
Analysis
The past three months show a bullish trend with significant resistance at 150. The recent candlestick patterns indicate bullish sentiment, but the RSI nearing overbought levels suggests caution. Volume has been low, indicating potential lack of conviction.
Confidence Level
Potential Risks
Market volatility and external economic news could impact this prediction.
1 Week Prediction
Target: August 20, 2025$149
$148.8
$150.5
$148
Description
With the current bullish trend and potential for further gains, a close around 149.000 is expected. The MACD remains bullish, and the price is approaching key Fibonacci retracement levels.
Analysis
The stock has shown a strong upward trend, with key support at 145. The MACD and moving averages indicate bullish momentum, but the RSI is approaching overbought territory, suggesting a possible pullback.
Confidence Level
Potential Risks
Potential market corrections or geopolitical events could lead to unexpected price movements.
1 Month Prediction
Target: September 12, 2025$150.5
$149
$152
$148.5
Description
The bullish trend is expected to continue, with a close around 150.500. The price is likely to test the upper Bollinger Band, and the MACD remains positive, indicating strong momentum.
Analysis
The last three months have shown a bullish trend with significant resistance at 150. The MACD and moving averages support further upward movement, but the RSI indicates potential overbought conditions, warranting caution.
Confidence Level
Potential Risks
Economic data releases and central bank decisions could significantly impact market sentiment.
3 Months Prediction
Target: November 12, 2025$152
$150
$154
$149
Description
Expecting a close around 152.000 as the bullish trend continues. The price may break through resistance levels, supported by positive economic indicators and market sentiment.
Analysis
The stock has shown a strong bullish trend, but the potential for market corrections exists. Key resistance levels are at 150 and 155. The MACD and moving averages indicate bullish momentum, but external factors could influence price direction.
Confidence Level
Potential Risks
Long-term predictions are subject to higher uncertainty due to potential market corrections and economic shifts.