XRP Trading Predictions
1 Day Prediction
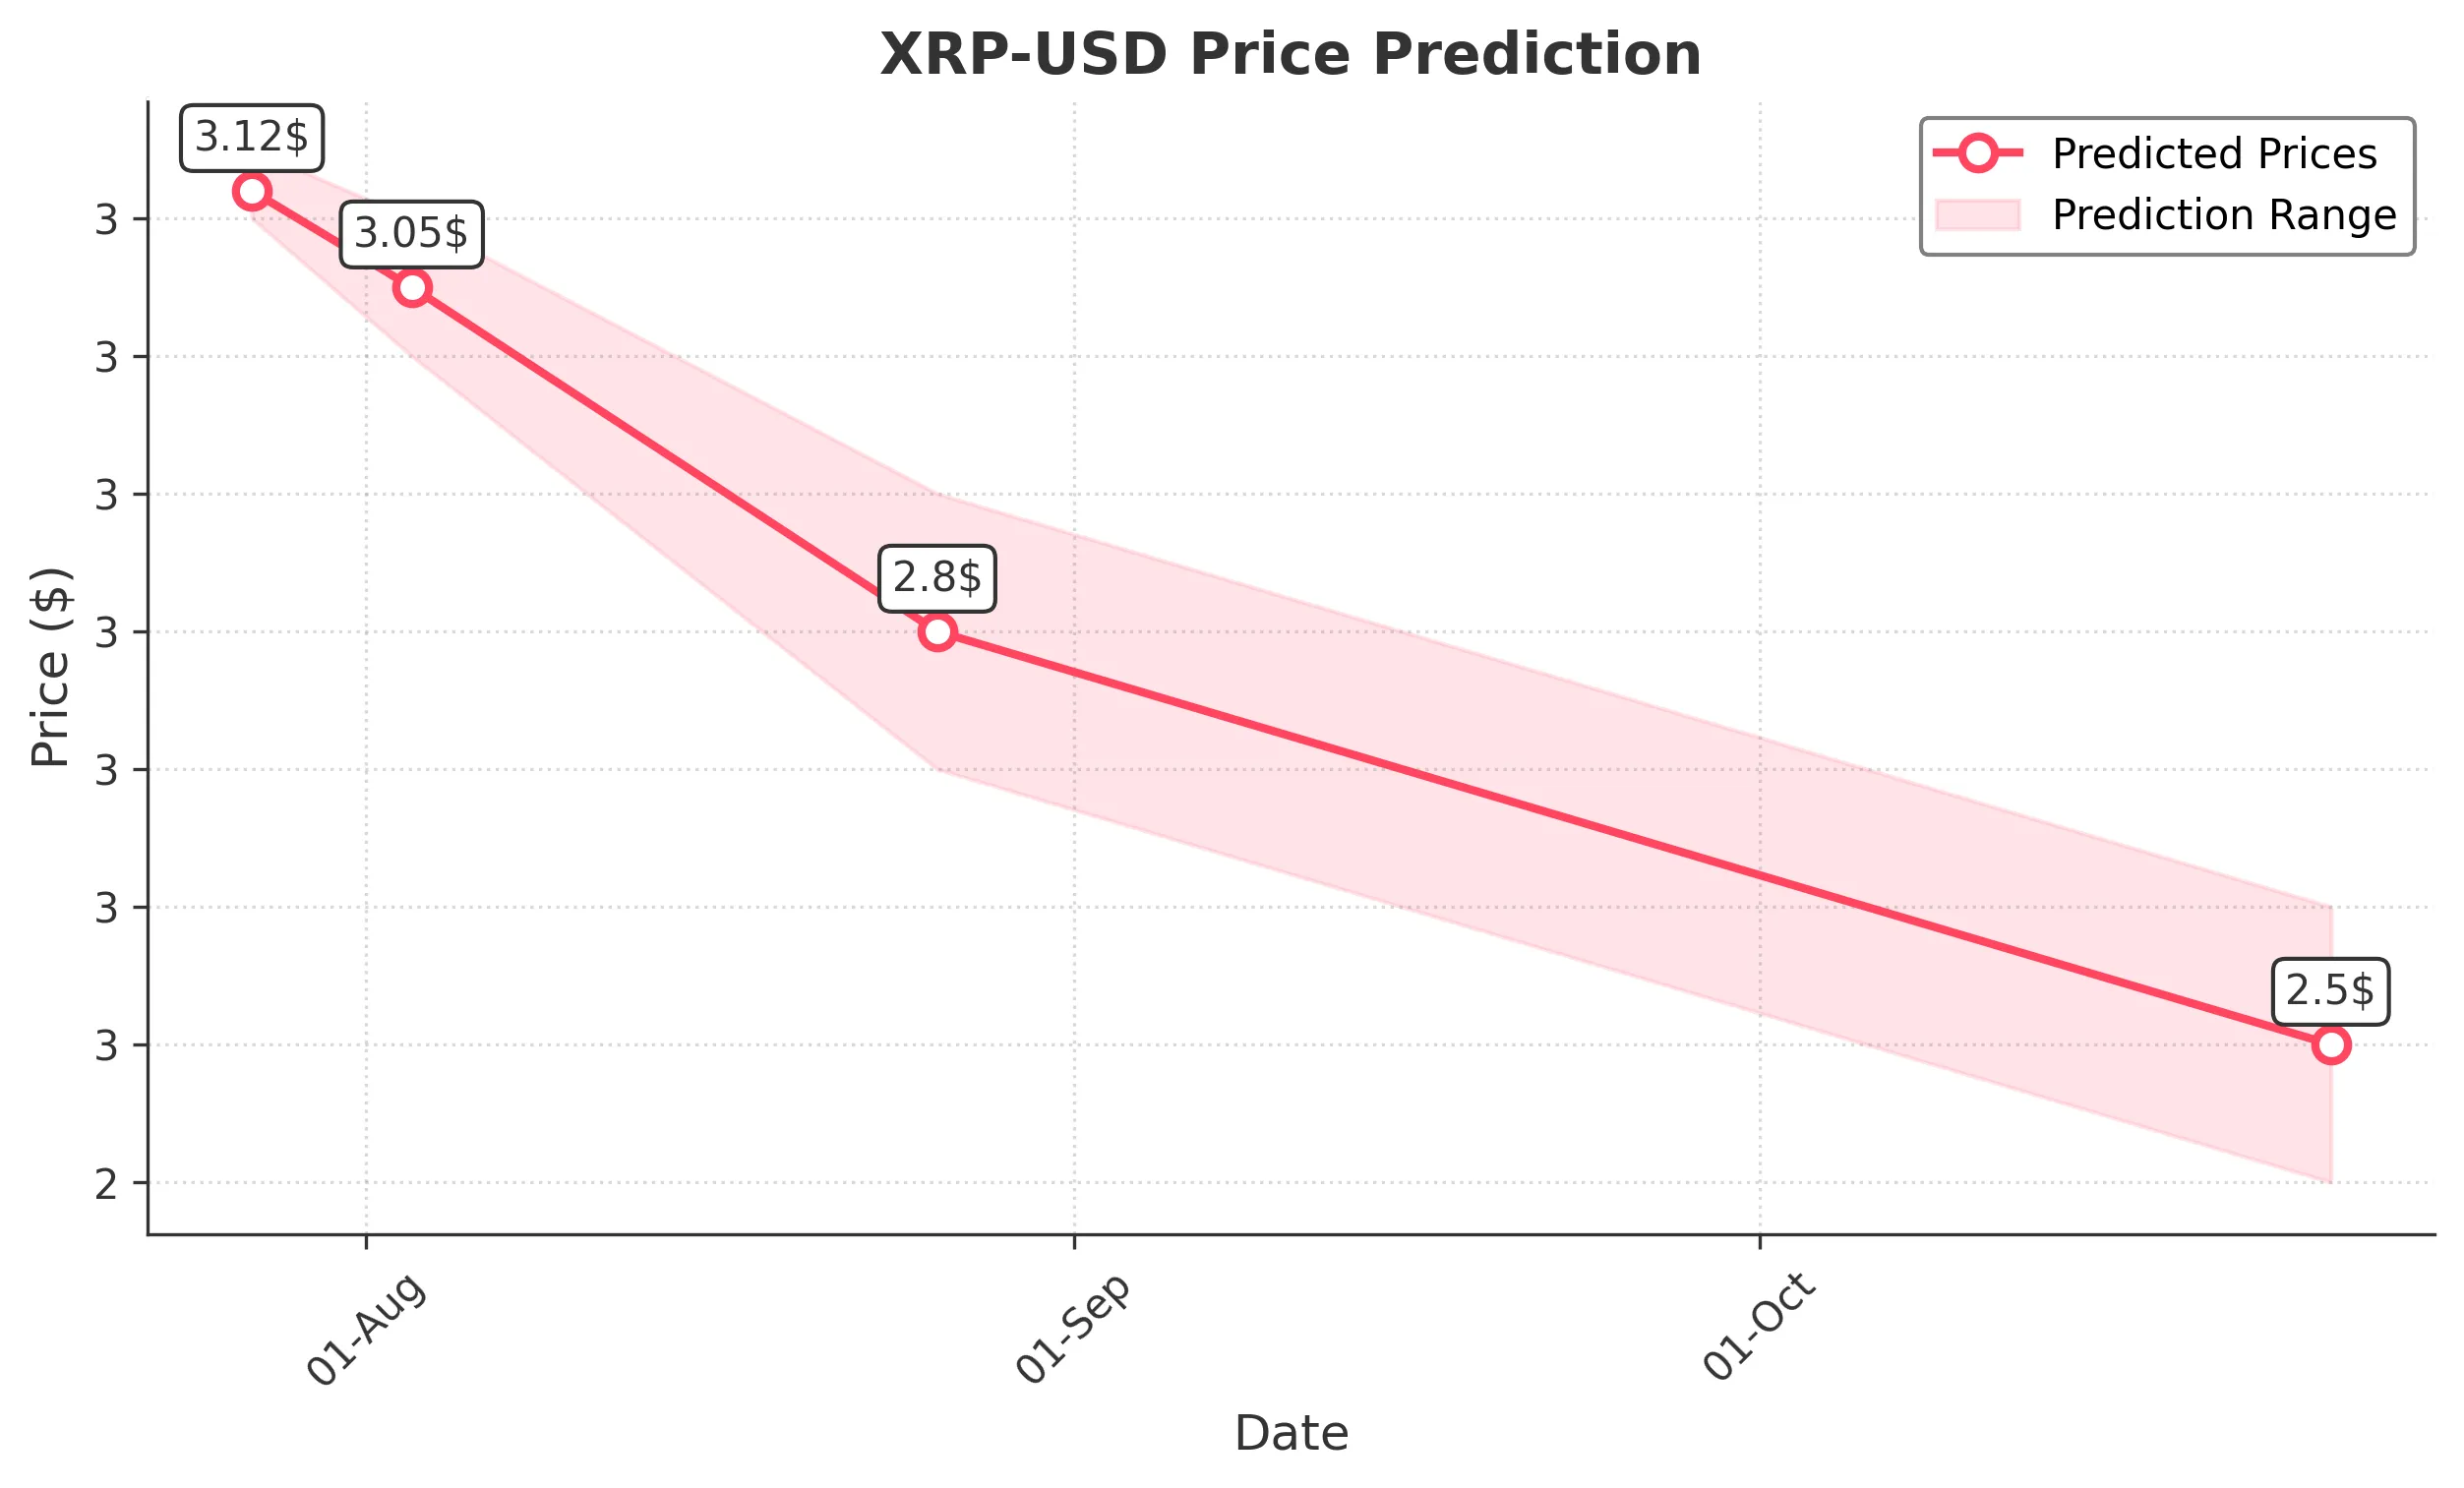
Target: July 27, 2025$3.12
$3.13
$3.15
$3.1
Description
The price is expected to stabilize around 3.12, supported by recent bullish momentum and a strong volume spike. RSI indicates overbought conditions, suggesting a potential pullback. However, the overall trend remains bullish.
Analysis
XRP has shown a strong bullish trend over the past three months, with significant price increases. Key resistance at 3.55 and support around 3.10. Volume spikes indicate strong buying interest, but overbought conditions may lead to short-term corrections.
Confidence Level
Potential Risks
Potential for a reversal exists due to overbought RSI levels and market sentiment shifts.
1 Week Prediction
Target: August 3, 2025$3.05
$3.12
$3.1
$3
Description
Expect a slight decline to 3.05 as profit-taking may occur after recent highs. The MACD shows signs of divergence, indicating potential weakening momentum. Volume remains strong, but caution is advised.
Analysis
The bullish trend is still intact, but signs of exhaustion are emerging. Key support at 3.00 may hold, while resistance at 3.55 remains a challenge. Volume patterns suggest strong interest, but caution is warranted due to potential profit-taking.
Confidence Level
Potential Risks
Market volatility and external news could impact price direction significantly.
1 Month Prediction
Target: August 26, 2025$2.8
$3.05
$2.9
$2.7
Description
A bearish trend is anticipated as the market corrects from recent highs. Fibonacci retracement levels suggest a pullback to 2.80. Volume may decrease as traders reassess positions.
Analysis
The market shows signs of a potential correction after a strong rally. Key support at 2.80 is critical, while resistance remains at 3.00. The overall sentiment is mixed, with some traders cautious about overextension.
Confidence Level
Potential Risks
Unforeseen macroeconomic events or regulatory news could lead to increased volatility.
3 Months Prediction
Target: October 26, 2025$2.5
$2.8
$2.6
$2.4
Description
Long-term bearish sentiment may drive prices down to 2.50 as market corrections continue. Technical indicators suggest a bearish trend, with potential support at 2.40.
Analysis
The overall trend appears to be shifting bearish after a strong rally. Key support levels are being tested, and if broken, further declines could occur. Volume analysis indicates a potential decrease in buying interest, warranting caution.
Confidence Level
Potential Risks
Market sentiment can shift rapidly, and external factors may influence price movements significantly.