XRP Trading Predictions
1 Day Prediction
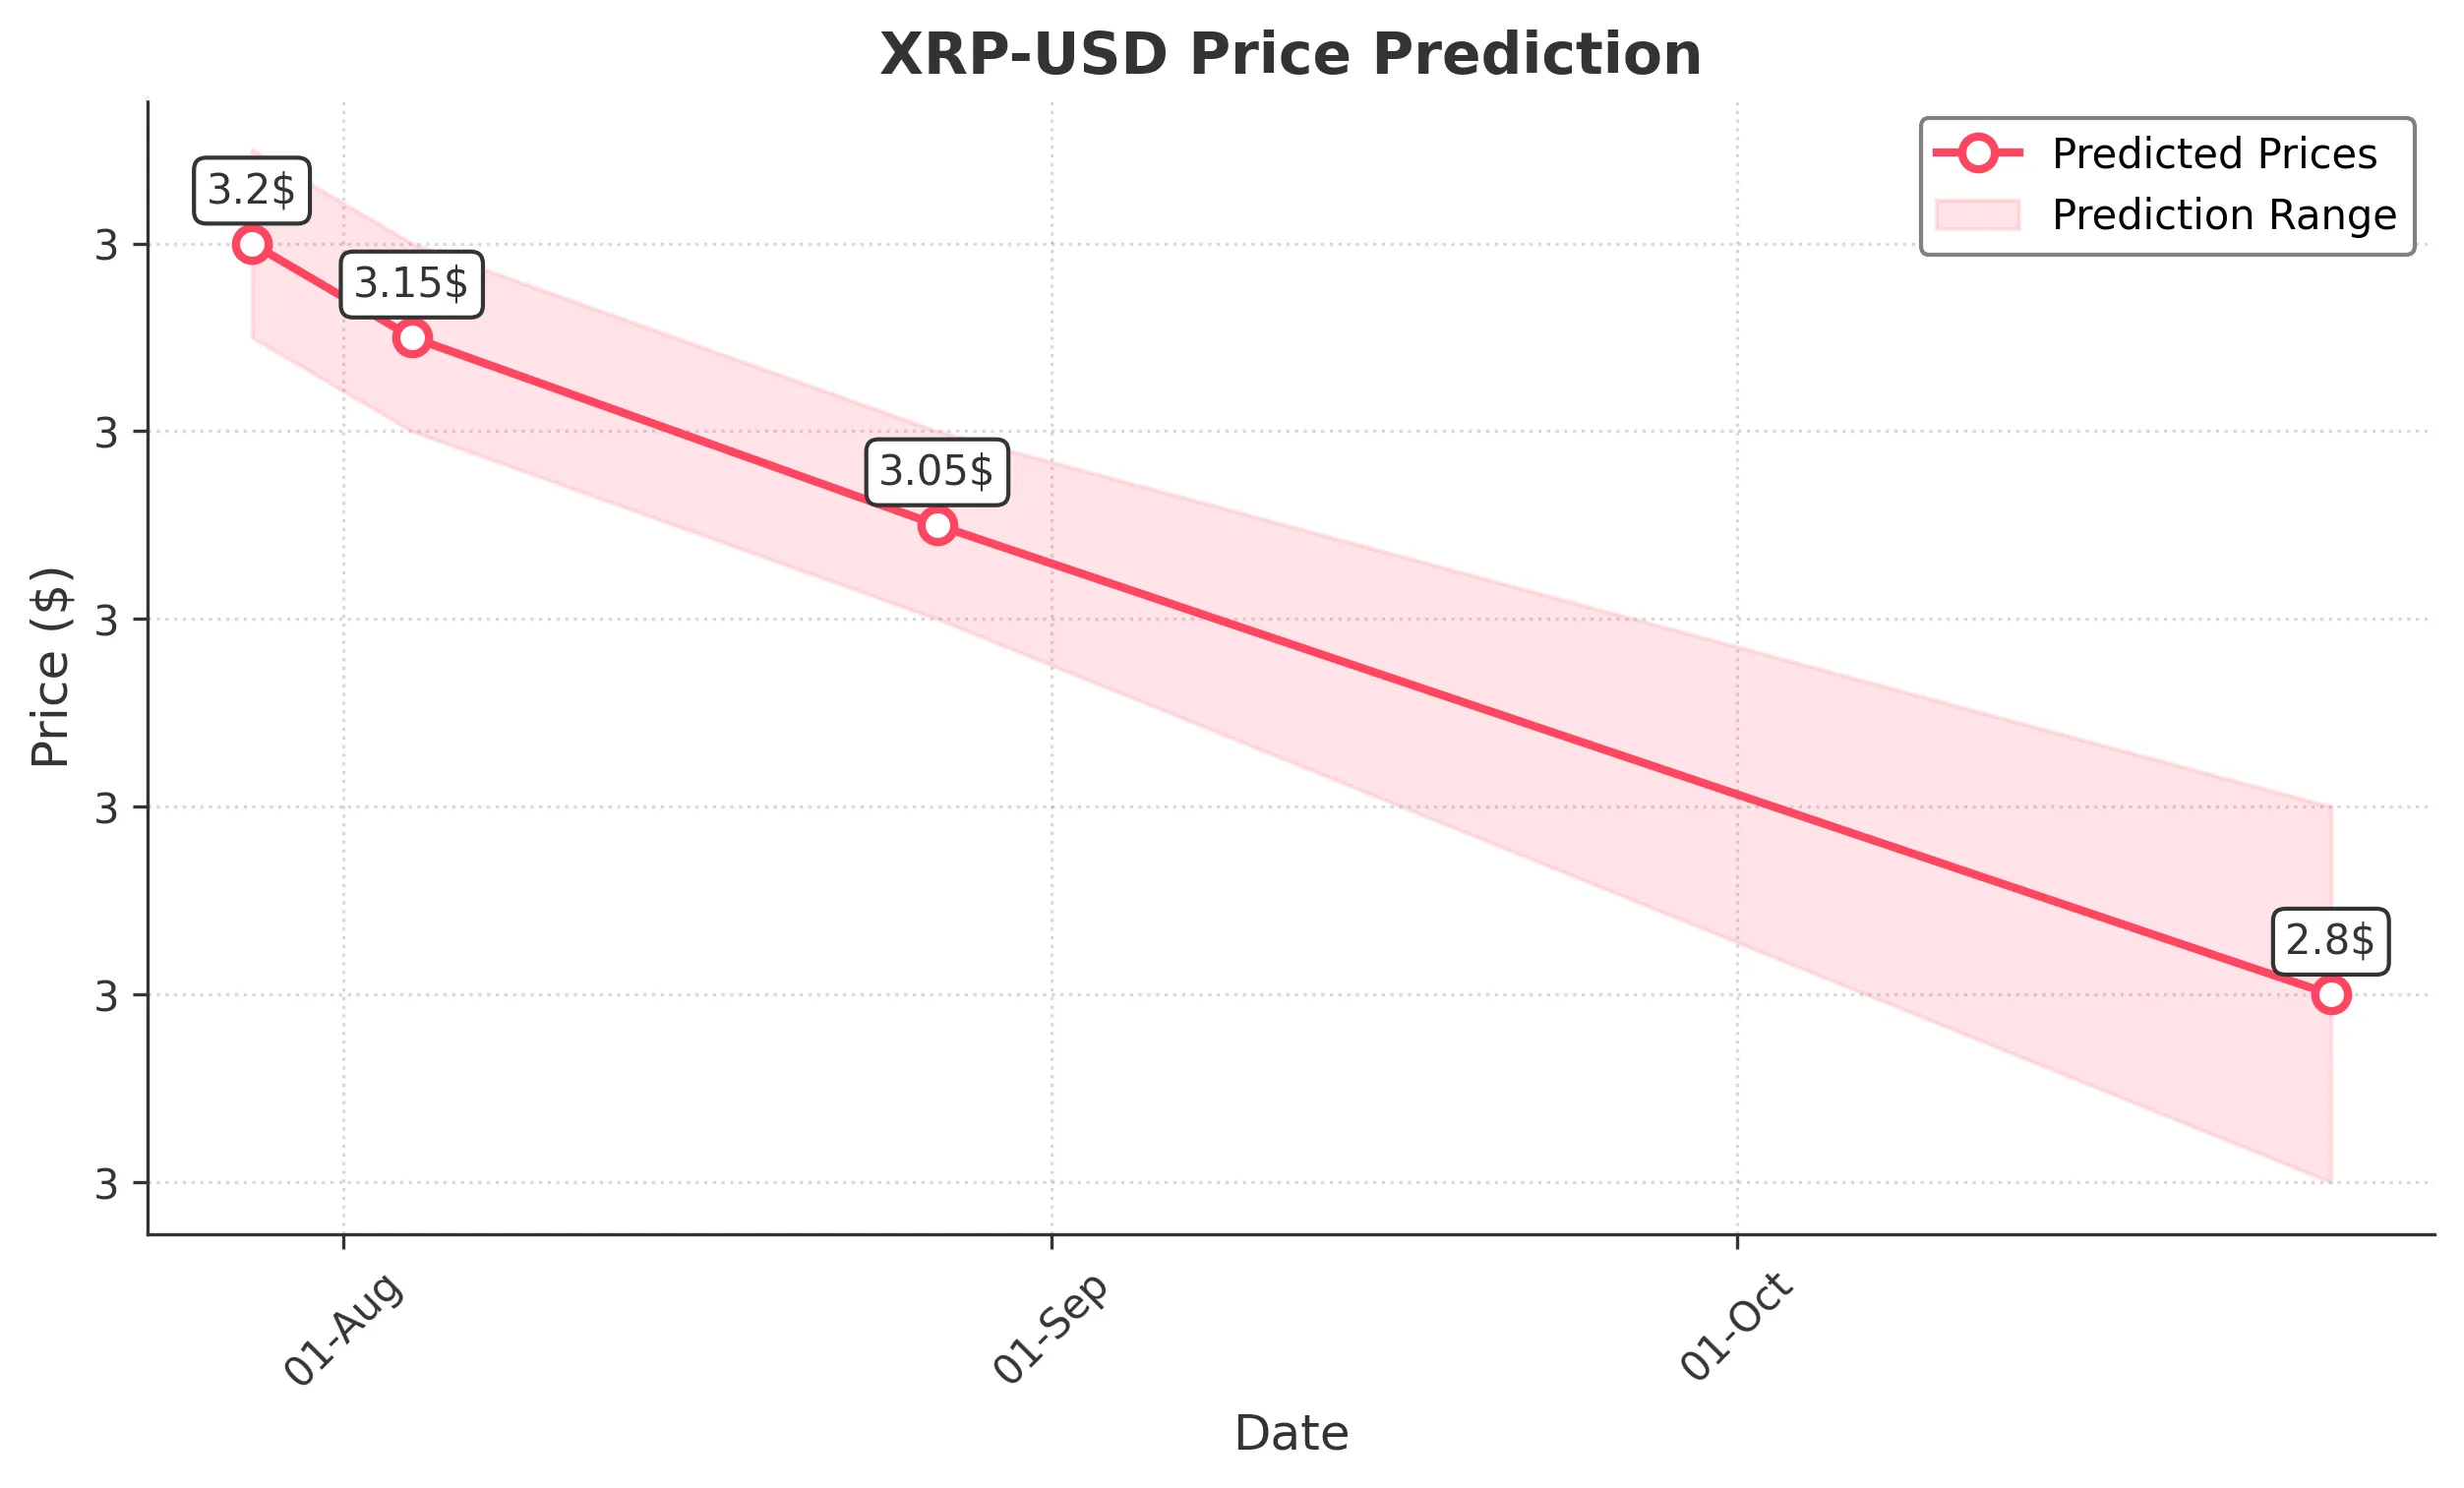
Target: July 28, 2025$3.2
$3.215
$3.25
$3.15
Description
The price is expected to stabilize around 3.20, supported by recent bullish momentum and a strong closing on July 27. RSI indicates overbought conditions, suggesting a potential pullback, but overall sentiment remains positive.
Analysis
XRP has shown a bullish trend over the past three months, with significant price increases. Key resistance at 3.55 and support around 3.14. Volume spikes indicate strong interest, but RSI suggests caution due to overbought conditions.
Confidence Level
Potential Risks
Potential for a pullback due to overbought RSI levels and recent volatility. Market sentiment could shift quickly.
1 Week Prediction
Target: August 4, 2025$3.15
$3.2
$3.2
$3.1
Description
Expect a slight decline to 3.15 as profit-taking may occur after recent highs. The MACD shows a bearish crossover, indicating potential downward pressure, while support at 3.14 may hold.
Analysis
The stock has been volatile, with significant price swings. Recent highs have created resistance at 3.55, while support at 3.14 is critical. The MACD and RSI suggest a potential correction, but overall bullish sentiment remains.
Confidence Level
Potential Risks
Market sentiment could shift rapidly, and unexpected news could impact prices significantly. Watch for volume changes.
1 Month Prediction
Target: August 27, 2025$3.05
$3.15
$3.1
$3
Description
A gradual decline to 3.05 is anticipated as market corrections take hold. The Bollinger Bands indicate tightening, suggesting reduced volatility, while the RSI may approach neutral levels.
Analysis
XRP has experienced a strong bullish run, but signs of exhaustion are emerging. Key support at 3.00 is critical, while resistance remains at 3.55. The market is showing signs of consolidation, with potential for further corrections.
Confidence Level
Potential Risks
Uncertainty in market conditions and potential regulatory news could impact prices. Watch for changes in trading volume.
3 Months Prediction
Target: October 27, 2025$2.8
$3
$2.9
$2.7
Description
A more significant decline to 2.80 is expected as market sentiment shifts. The Fibonacci retracement levels suggest potential support at 2.80, but bearish trends may dominate.
Analysis
The overall trend shows a potential bearish reversal after a strong bullish phase. Key support at 2.80 and resistance at 3.55 are critical. The market is likely to face headwinds from profit-taking and external economic factors.
Confidence Level
Potential Risks
Market volatility and external factors such as regulatory changes could lead to unexpected price movements. Watch for macroeconomic influences.