XRP Trading Predictions
1 Day Prediction
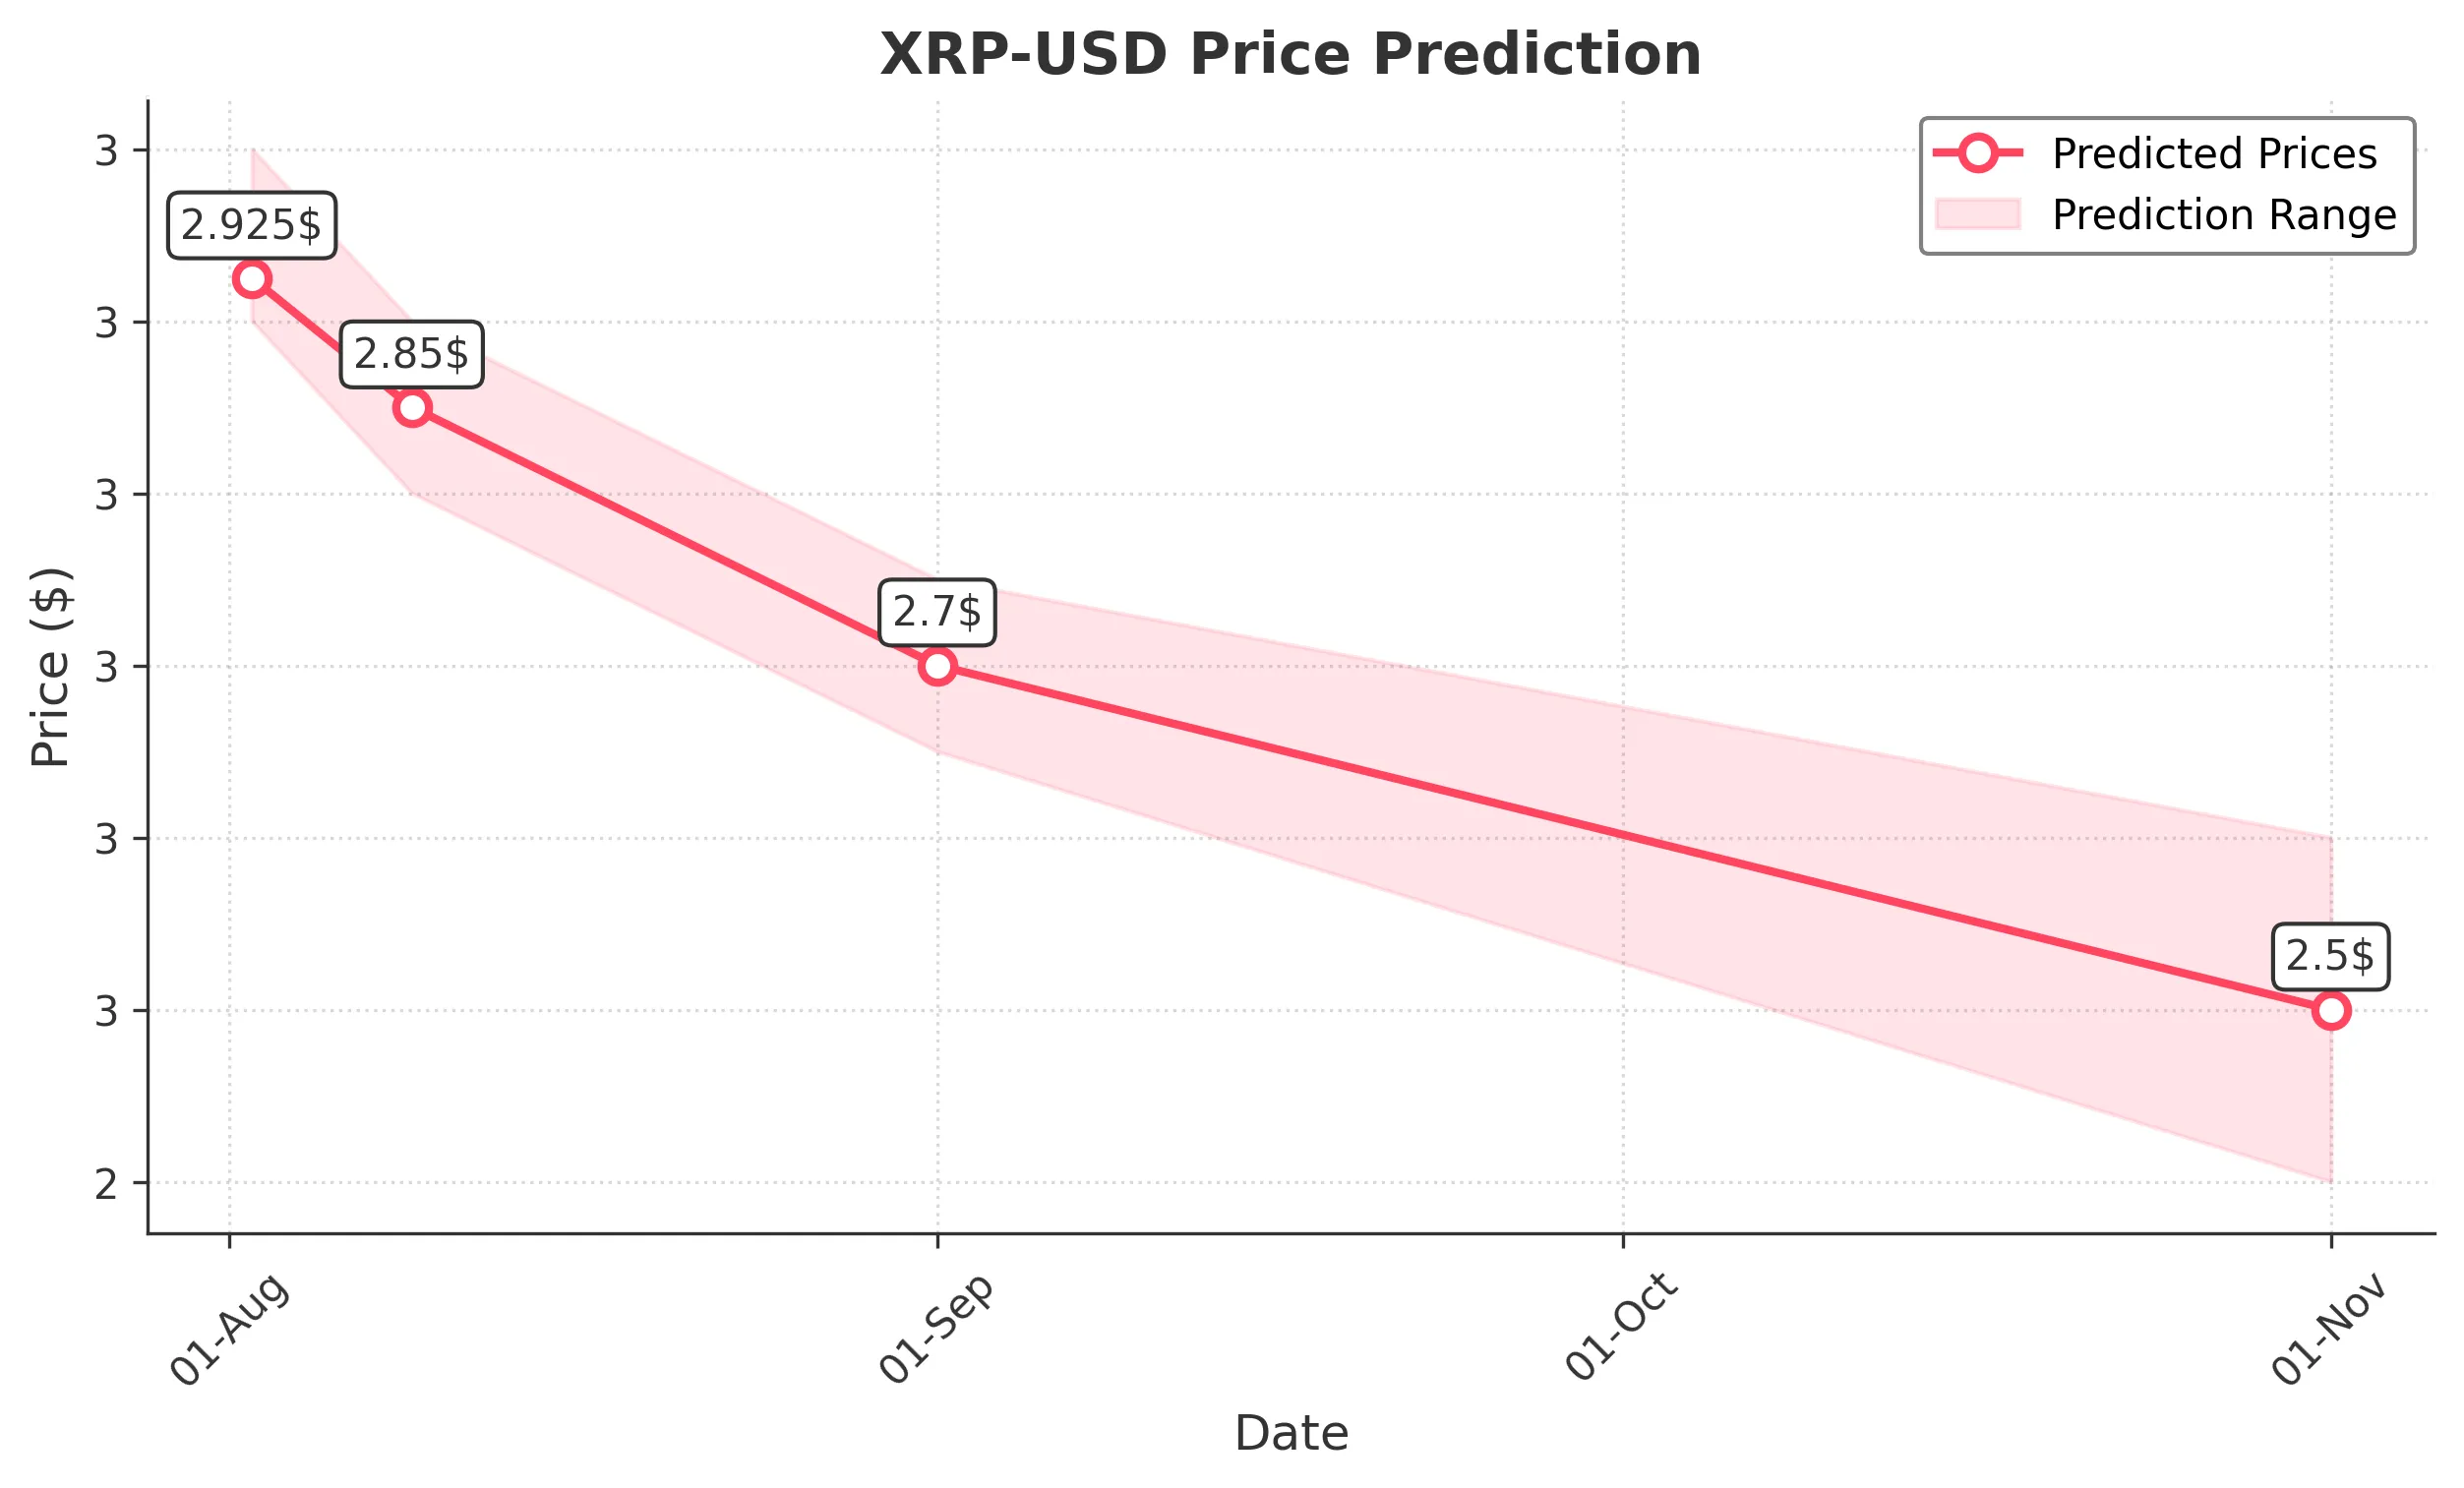
Target: August 2, 2025$2.925
$2.95
$3
$2.9
Description
The price is expected to slightly decline due to recent bearish candlestick patterns and a potential resistance at 3.00. RSI indicates overbought conditions, suggesting a pullback. Volume remains high, indicating strong market interest.
Analysis
XRP has shown a bullish trend over the past three months, peaking at 3.74. However, recent price action indicates a potential reversal with lower highs and increased selling pressure. Key support at 2.90 and resistance at 3.00 are critical levels to watch.
Confidence Level
Potential Risks
Market volatility and external news could impact the price unexpectedly.
1 Week Prediction
Target: August 9, 2025$2.85
$2.925
$2.9
$2.8
Description
A continued downward trend is anticipated as bearish momentum builds. The MACD shows a bearish crossover, and RSI is trending downwards. Volume may decrease as traders take profits, leading to lower prices.
Analysis
The stock has been volatile, with significant price swings. The recent high volume indicates strong trading interest, but the overall trend appears to be shifting bearish. Key support at 2.80 is crucial for maintaining upward momentum.
Confidence Level
Potential Risks
Unexpected bullish news or market sentiment shifts could reverse this trend.
1 Month Prediction
Target: September 1, 2025$2.7
$2.85
$2.75
$2.65
Description
The price is expected to decline further as bearish sentiment prevails. The Bollinger Bands indicate a squeeze, suggesting potential volatility. A break below 2.80 could lead to further declines towards 2.70.
Analysis
XRP has experienced a significant rally but is now facing resistance. The overall trend is bearish, with key support levels being tested. The market is reacting to external factors, including regulatory news and macroeconomic conditions.
Confidence Level
Potential Risks
Market sentiment and macroeconomic factors could lead to unexpected price movements.
3 Months Prediction
Target: November 1, 2025$2.5
$2.7
$2.6
$2.4
Description
A bearish outlook is anticipated as the market adjusts to recent highs. The Fibonacci retracement levels suggest a potential drop towards 2.50. Continued selling pressure and lower volume may indicate a lack of buying interest.
Analysis
The past three months have shown a volatile market with significant price fluctuations. The overall trend appears to be bearish, with key support levels being tested. Market sentiment is cautious, and external factors could lead to further declines.
Confidence Level
Potential Risks
Long-term market trends and external economic factors could significantly alter this prediction.