XRP Trading Predictions
1 Day Prediction
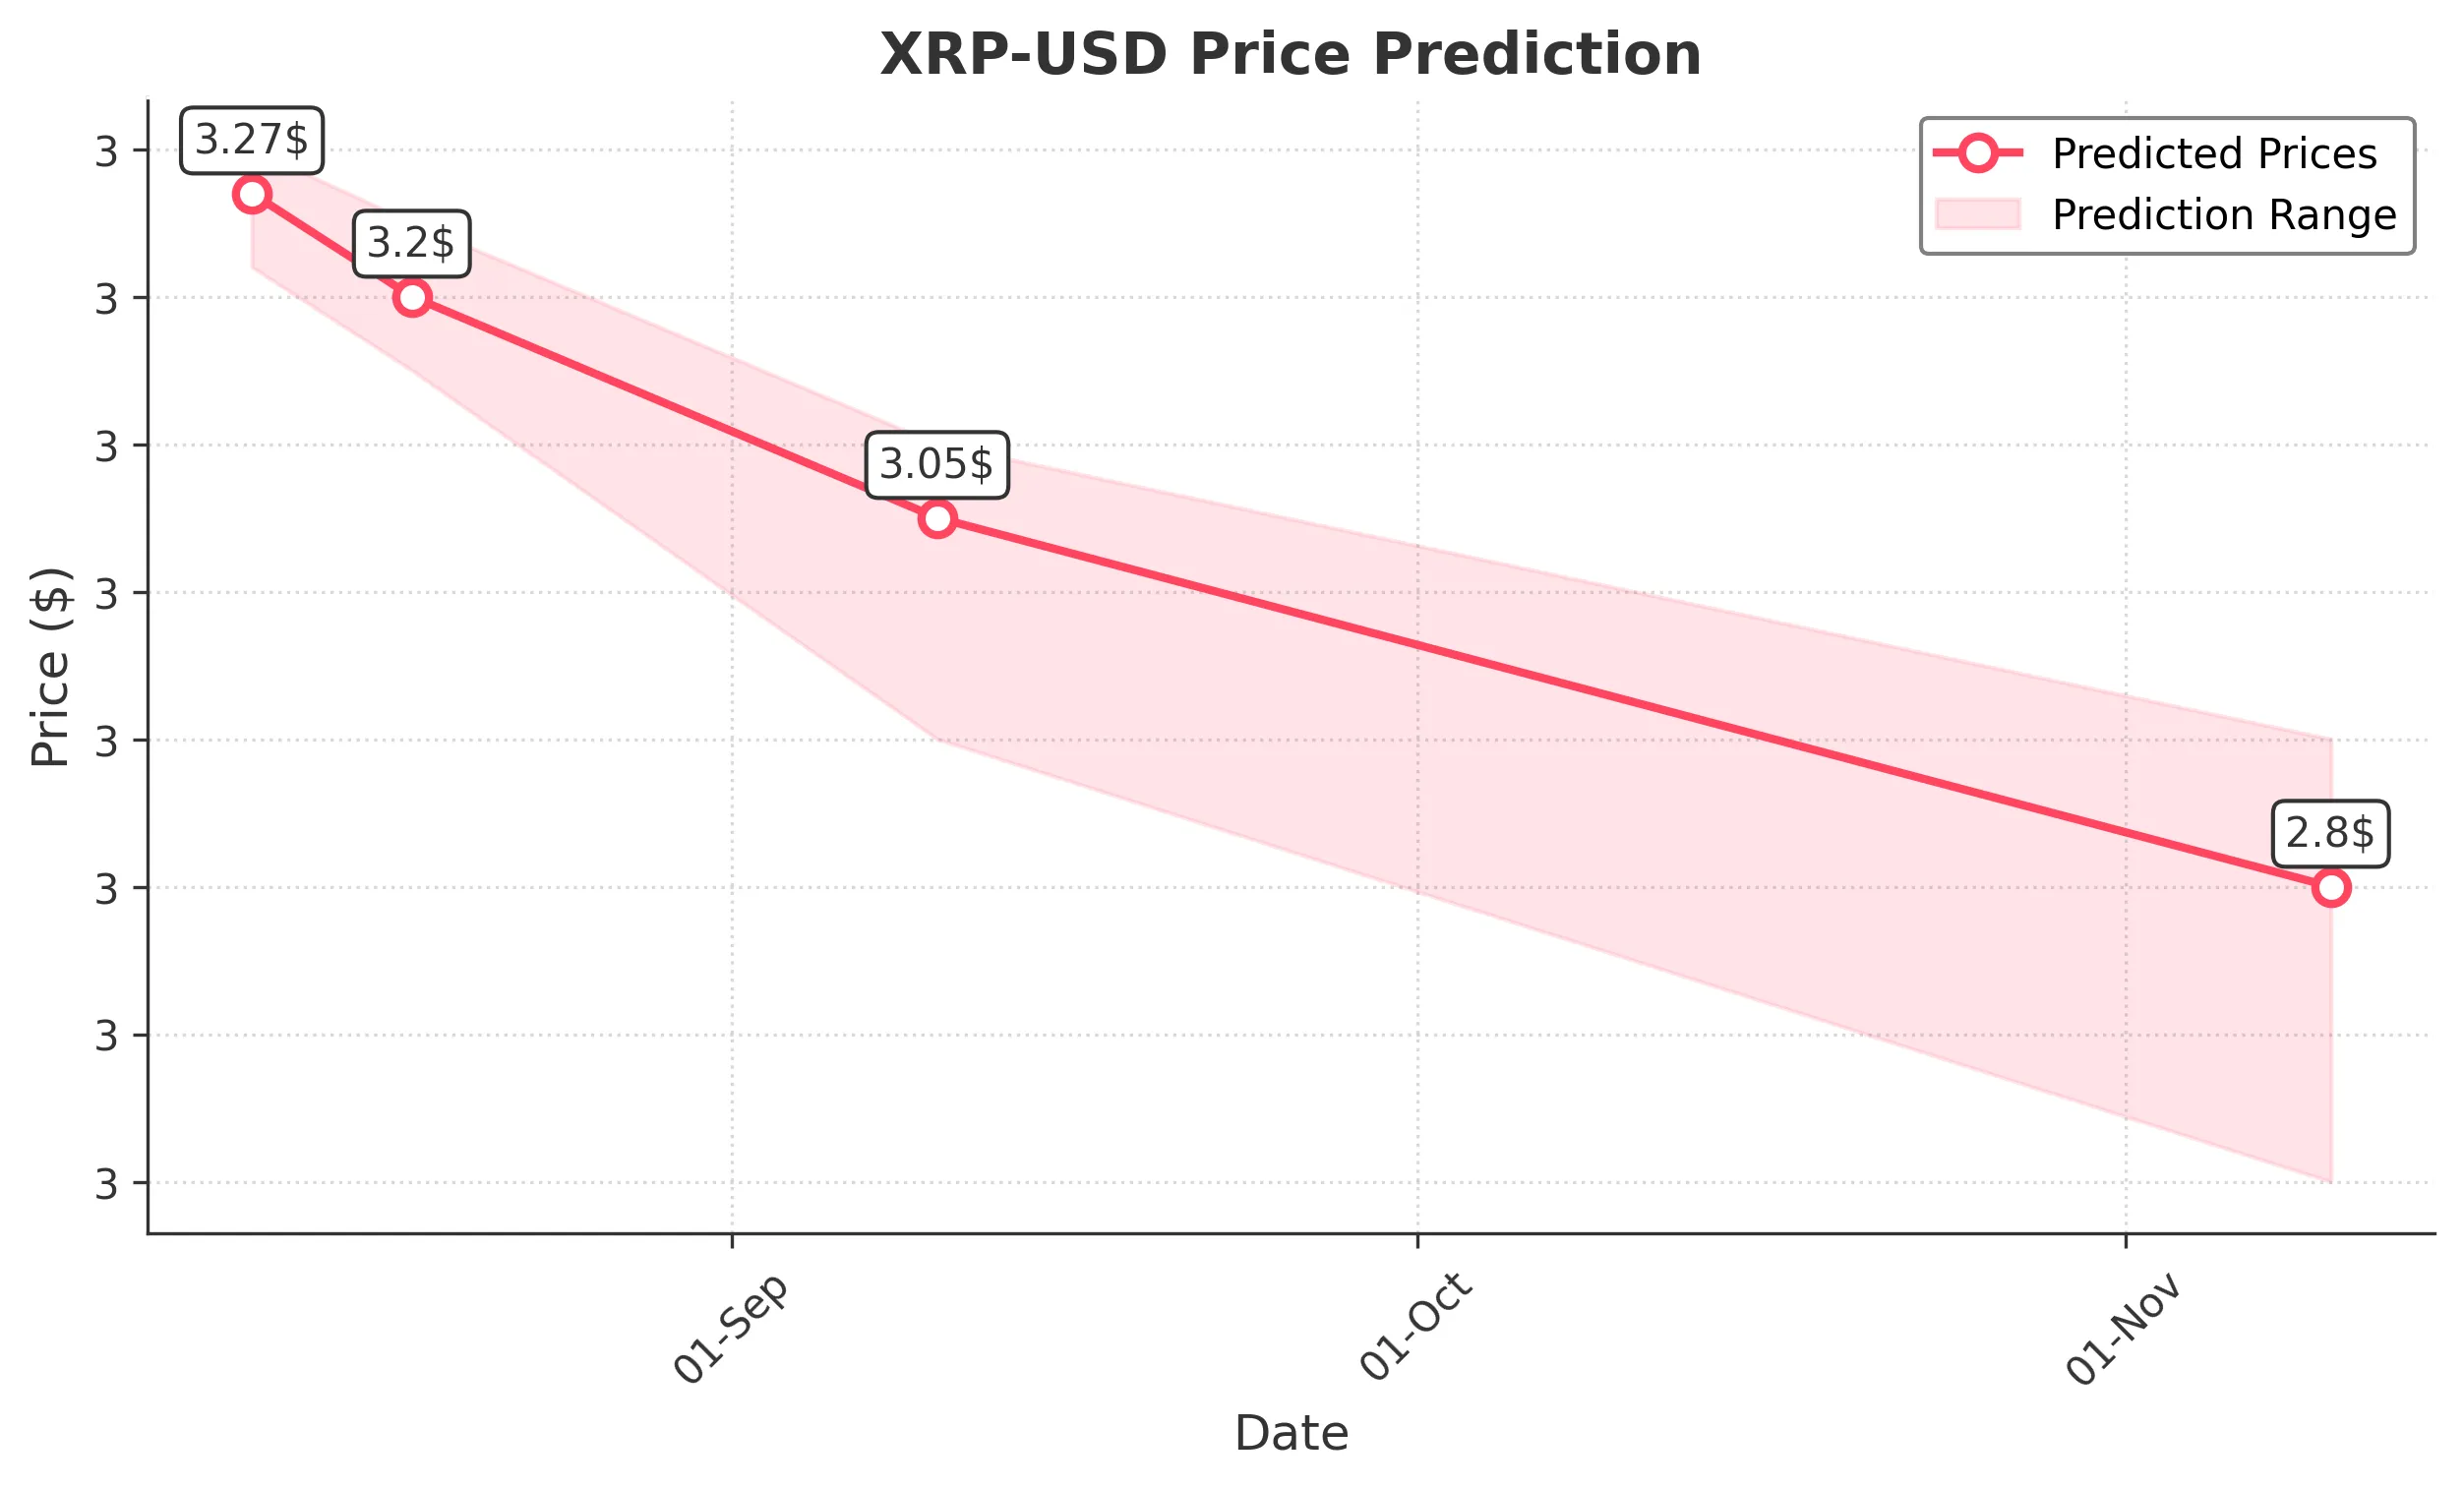
Target: August 11, 2025$3.27
$3.255891
$3.3
$3.22
Description
The price is expected to stabilize around 3.27, supported by recent bullish momentum and a strong close. RSI indicates overbought conditions, suggesting a potential pullback. Volume remains high, indicating strong interest.
Analysis
XRP has shown a bullish trend over the past three months, with significant price increases. Key resistance at 3.30 and support around 3.00. Recent volume spikes indicate strong buying interest, but overbought conditions may lead to short-term corrections.
Confidence Level
Potential Risks
Potential for a pullback due to overbought RSI and market sentiment shifts.
1 Week Prediction
Target: August 18, 2025$3.2
$3.27
$3.25
$3.15
Description
Expect a slight decline to 3.20 as profit-taking may occur after recent highs. The MACD shows signs of weakening momentum, and RSI is approaching overbought territory, indicating potential corrections.
Analysis
The bullish trend is showing signs of fatigue, with resistance at 3.30. Volume has been high, but a potential correction is indicated by the MACD and RSI. Support at 3.00 remains critical for maintaining upward momentum.
Confidence Level
Potential Risks
Market volatility and external news could impact price direction.
1 Month Prediction
Target: September 10, 2025$3.05
$3.2
$3.1
$2.9
Description
A further decline to 3.05 is anticipated as market sentiment shifts. The Bollinger Bands indicate potential volatility, and the price may test lower support levels. Watch for volume spikes that could signal reversals.
Analysis
XRP's performance shows a potential bearish reversal after a strong rally. Key support at 3.00 is critical. The market is reacting to external factors, and the overall sentiment is cautious, suggesting a possible downward trend.
Confidence Level
Potential Risks
Unforeseen macroeconomic events could lead to significant price fluctuations.
3 Months Prediction
Target: November 10, 2025$2.8
$3.05
$2.9
$2.6
Description
Expect a continued downtrend to 2.80 as bearish sentiment prevails. The Fibonacci retracement levels suggest a test of lower support. Volume may decrease as traders reassess positions.
Analysis
The overall trend appears bearish, with significant resistance at 3.00. The market is reacting to broader economic conditions, and the potential for further declines exists. Key support levels will be crucial in the coming months.
Confidence Level
Potential Risks
Market conditions and regulatory news could significantly alter price trajectories.